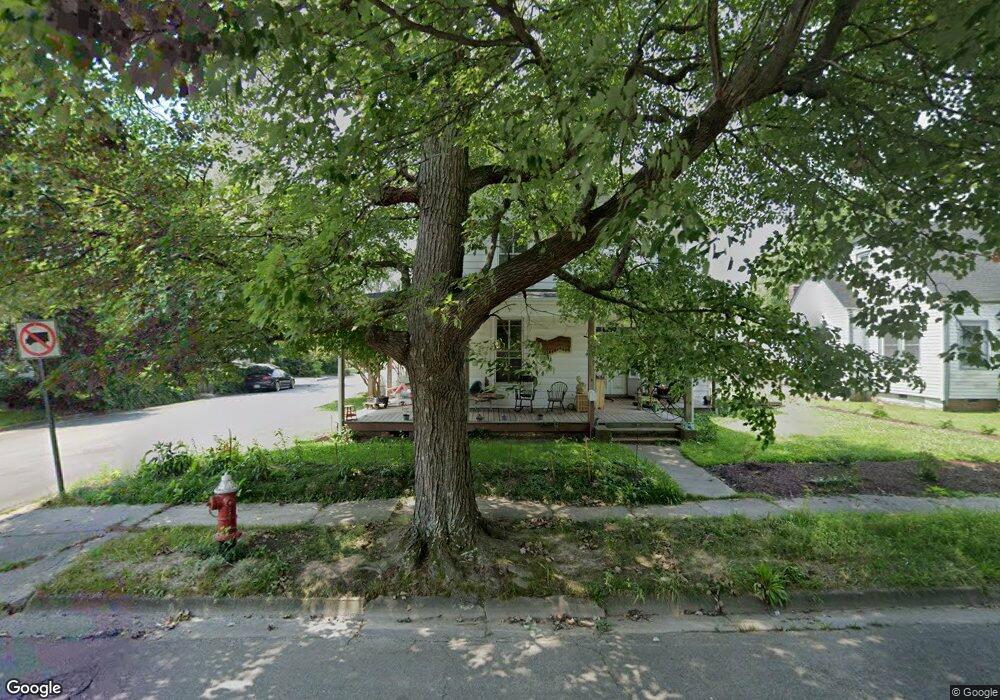
401 Norfleet St Franklin, VA 23851
Estimated Value: $102,000 - $229,207
3
Beds
2
Baths
1,938
Sq Ft
$72/Sq Ft
Est. Value
About This Home
This home is located at 401 Norfleet St, Franklin, VA 23851 and is currently estimated at $138,802, approximately $71 per square foot. 401 Norfleet St is a home located in Franklin City with nearby schools including S.P. Morton Elementary School, Joseph P. King Jr. Middle School, and Franklin High School.
Ownership History
Date
Name
Owned For
Owner Type
Purchase Details
Closed on
Nov 8, 2024
Sold by
Grandy Frederick G
Bought by
Brenda Lewis Llc
Current Estimated Value
Purchase Details
Closed on
Nov 6, 2024
Sold by
Franklin Town Investments Ltd
Bought by
Grandy Frederick G
Purchase Details
Closed on
Feb 17, 2023
Sold by
Franklin Towne Investments Ltd
Bought by
Grandy Frederick G
Create a Home Valuation Report for This Property
The Home Valuation Report is an in-depth analysis detailing your home's value as well as a comparison with similar homes in the area
Home Values in the Area
Average Home Value in this Area
Purchase History
| Date | Buyer | Sale Price | Title Company |
|---|---|---|---|
| Brenda Lewis Llc | $105,500 | American Land Title Associatio | |
| Brenda Lewis Llc | $105,500 | American Land Title Associatio | |
| Grandy Frederick G | $89,900 | None Listed On Document | |
| Grandy Frederick G | $89,900 | None Listed On Document | |
| Grandy Frederick G | $89,900 | -- |
Source: Public Records
Tax History
| Year | Tax Paid | Tax Assessment Tax Assessment Total Assessment is a certain percentage of the fair market value that is determined by local assessors to be the total taxable value of land and additions on the property. | Land | Improvement |
|---|---|---|---|---|
| 2025 | $1,178 | $114,400 | $40,000 | $74,400 |
| 2024 | -- | $114,400 | $40,000 | $74,400 |
| 2023 | $782 | $75,900 | $18,600 | $57,300 |
| 2022 | $782 | $75,900 | $18,600 | $57,300 |
| 2021 | $717 | $69,600 | $16,900 | $52,700 |
| 2020 | $848 | $69,600 | $16,900 | $52,700 |
| 2019 | $848 | $85,700 | $16,900 | $68,800 |
| 2018 | $848 | $85,700 | $16,900 | $68,800 |
| 2017 | $798 | $80,600 | $16,100 | $64,500 |
| 2016 | $798 | $80,600 | $16,100 | $64,500 |
| 2015 | -- | $0 | $0 | $0 |
| 2014 | -- | $0 | $0 | $0 |
| 2013 | -- | $0 | $0 | $0 |
Source: Public Records
Map
Nearby Homes
Your Personal Tour Guide
Ask me questions while you tour the home.