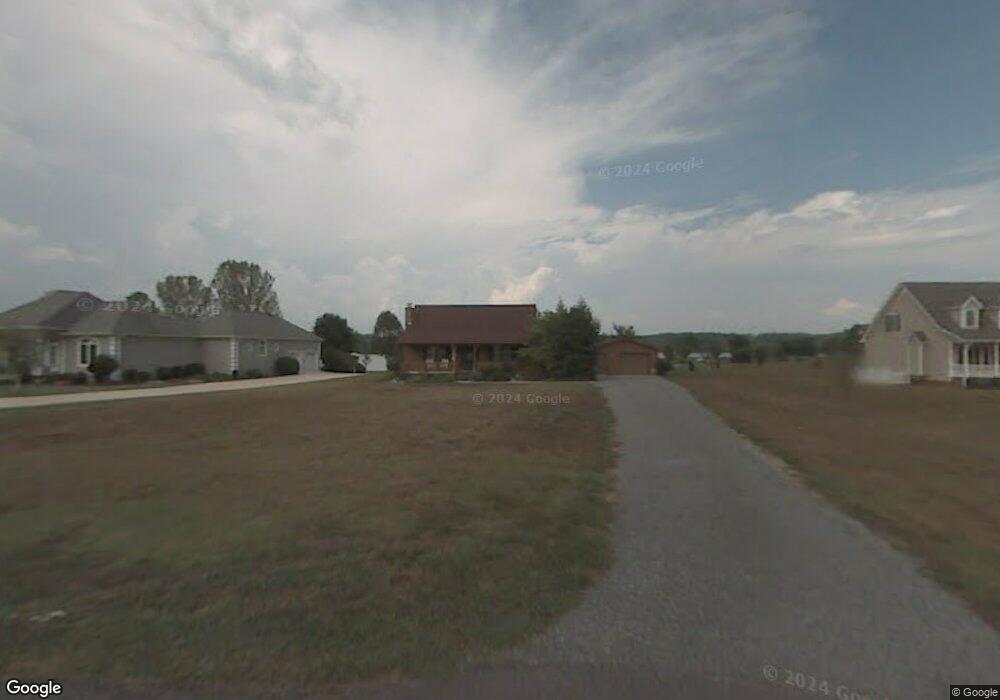
401 Rockholt Ln Georgetown, TN 37336
Estimated Value: $635,000 - $836,000
2
Beds
2
Baths
1,786
Sq Ft
$408/Sq Ft
Est. Value
About This Home
This home is located at 401 Rockholt Ln, Georgetown, TN 37336 and is currently estimated at $728,044, approximately $407 per square foot. 401 Rockholt Ln is a home located in Meigs County with nearby schools including Meigs County High School.
Ownership History
Date
Name
Owned For
Owner Type
Purchase Details
Closed on
Jun 20, 2025
Sold by
Wood Danny and Wood Kathy
Bought by
Mcalister Daniel and Mcalister Ashley
Current Estimated Value
Home Financials for this Owner
Home Financials are based on the most recent Mortgage that was taken out on this home.
Original Mortgage
$640,000
Outstanding Balance
$638,341
Interest Rate
6.76%
Mortgage Type
New Conventional
Estimated Equity
$89,703
Purchase Details
Closed on
Jun 12, 2019
Sold by
Jackson Carolyn B
Bought by
Wood Danny and Wood Kathy
Purchase Details
Closed on
Aug 13, 1992
Bought by
Chambers John W and Chambers Carole
Purchase Details
Closed on
Apr 23, 1992
Bought by
Lawson Danny and Lawson Robin
Purchase Details
Closed on
Jul 18, 1985
Bought by
Lawson Danny and Lawson Robin
Create a Home Valuation Report for This Property
The Home Valuation Report is an in-depth analysis detailing your home's value as well as a comparison with similar homes in the area
Home Values in the Area
Average Home Value in this Area
Purchase History
| Date | Buyer | Sale Price | Title Company |
|---|---|---|---|
| Mcalister Daniel | $800,000 | Equititle | |
| Mcalister Daniel | $800,000 | Equititle | |
| Wood Danny | $332,000 | -- | |
| Wood Danny | $332,000 | -- | |
| Chambers John W | $116,000 | -- | |
| Chambers John W | $116,000 | -- | |
| Lawson Danny | -- | -- | |
| Lawson Danny | -- | -- | |
| Lawson Danny | -- | -- | |
| Lawson Danny | -- | -- |
Source: Public Records
Mortgage History
| Date | Status | Borrower | Loan Amount |
|---|---|---|---|
| Open | Mcalister Daniel | $640,000 | |
| Closed | Mcalister Daniel | $640,000 |
Source: Public Records
Tax History Compared to Growth
Tax History
| Year | Tax Paid | Tax Assessment Tax Assessment Total Assessment is a certain percentage of the fair market value that is determined by local assessors to be the total taxable value of land and additions on the property. | Land | Improvement |
|---|---|---|---|---|
| 2024 | $1,477 | $87,500 | $32,500 | $55,000 |
| 2023 | $1,477 | $87,500 | $32,500 | $55,000 |
| 2022 | $1,477 | $87,500 | $32,500 | $55,000 |
| 2021 | $1,477 | $87,500 | $32,500 | $55,000 |
| 2020 | $1,323 | $87,500 | $32,500 | $55,000 |
| 2019 | $1,323 | $66,750 | $22,500 | $44,250 |
| 2018 | $1,323 | $66,750 | $22,500 | $44,250 |
| 2017 | $1,323 | $66,750 | $22,500 | $44,250 |
| 2016 | $1,323 | $66,750 | $22,500 | $44,250 |
| 2015 | $1,250 | $66,750 | $22,500 | $44,250 |
| 2014 | $1,049 | $56,025 | $21,625 | $34,400 |
Source: Public Records
Map
Nearby Homes
- 334 Windmill Ln
- 362 Windmill Ln
- 238 Ware Ln
- 675 Ware Ln
- 383 Lakehaven Cir
- 783 Lakehaven Cir
- 482 Hiwassee Dr
- 152 Hiwassee Dr
- Lot 7 Lake Forest Dr
- 5682 Tennessee 58
- 132 Hiwassee Dr
- 0 Horner Hollow Rd Unit 1522334
- 0 Horner Hollow Rd Unit RTC3007780
- 0 Horner Hollow Rd Unit 20254688
- 3313 Redman Ln
- 260 Sam Johnson Rd NW
- 225 Woods Subdivision Ln
- Tract 1 Redman Ridge Ln
- Tract 1 Redman Ridge Ln
- 2b Redman Ridge Ln
- 345 Rockholt Ln
- 421 Rockholt Ln
- Lot # 4 Rockholt Ln
- Lot # 3 Rockholt Ln
- Lot # 2 Rockholt Ln
- Lot # 1 Rockholt Ln
- Lot 3 Rockholt Ln
- Lot 2 Rockholt Ln
- Lot 1 Rockholt Ln
- 331 Rockholt Ln
- 3 Rockholt Ln
- 1 Rockholt Ln
- 2 Rockholt Ln
- 0 Rockholt Ln
- Rockholt C Rockholt Ln
- Rockholt Cir Rockholt Ln
- 477 Rockholt Ln
- 441 Rockholt Ln
- 311 Rockholt Ln
- 344 Rockholt Ln