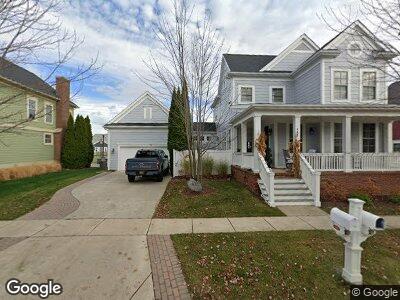
401 Roosevelt St Unit 226 Canton, MI 48188
Cherry Hill NeighborhoodEstimated Value: $490,000 - $502,000
--
Bed
3
Baths
2,364
Sq Ft
$210/Sq Ft
Est. Value
About This Home
This home is located at 401 Roosevelt St Unit 226, Canton, MI 48188 and is currently estimated at $496,668, approximately $210 per square foot. 401 Roosevelt St Unit 226 is a home located in Wayne County with nearby schools including Canton High School, Workman Elementary School, and Plymouth High School.
Ownership History
Date
Name
Owned For
Owner Type
Purchase Details
Closed on
Jul 13, 2022
Sold by
Crager Mark and Crager Paula M
Bought by
Crager Paula M and Crager Darcie E
Current Estimated Value
Home Financials for this Owner
Home Financials are based on the most recent Mortgage that was taken out on this home.
Original Mortgage
$50,000
Interest Rate
5.78%
Mortgage Type
Credit Line Revolving
Purchase Details
Closed on
Oct 6, 2004
Sold by
Chv Building Co Llc
Bought by
Crager Mark
Home Financials for this Owner
Home Financials are based on the most recent Mortgage that was taken out on this home.
Original Mortgage
$265,000
Interest Rate
5.12%
Mortgage Type
Unknown
Create a Home Valuation Report for This Property
The Home Valuation Report is an in-depth analysis detailing your home's value as well as a comparison with similar homes in the area
Home Values in the Area
Average Home Value in this Area
Purchase History
| Date | Buyer | Sale Price | Title Company |
|---|---|---|---|
| Crager Paula M | -- | -- | |
| Crager Mark | $346,091 | William T Sheahan Title Co |
Source: Public Records
Mortgage History
| Date | Status | Borrower | Loan Amount |
|---|---|---|---|
| Previous Owner | Crager Mark | $50,000 | |
| Previous Owner | Crager Paula M | $241,000 | |
| Previous Owner | Crager Paula M | $255,000 | |
| Previous Owner | Crager Mark | $25,000 | |
| Previous Owner | Crager Mark | $250,325 | |
| Previous Owner | Crager Mark D | $259,900 | |
| Previous Owner | Crager Mark D | $20,000 | |
| Previous Owner | Crager Mark D | $265,000 | |
| Previous Owner | Crager Mark D | $64,100 | |
| Previous Owner | Chv Building Co Llc | $9,000,000 |
Source: Public Records
Tax History Compared to Growth
Tax History
| Year | Tax Paid | Tax Assessment Tax Assessment Total Assessment is a certain percentage of the fair market value that is determined by local assessors to be the total taxable value of land and additions on the property. | Land | Improvement |
|---|---|---|---|---|
| 2024 | $3,005 | $227,500 | $0 | $0 |
| 2023 | $2,865 | $197,500 | $0 | $0 |
| 2022 | $6,209 | $182,900 | $0 | $0 |
| 2021 | $6,025 | $181,900 | $0 | $0 |
| 2020 | $5,953 | $180,700 | $0 | $0 |
| 2019 | $5,844 | $171,940 | $0 | $0 |
| 2018 | $2,435 | $163,930 | $0 | $0 |
| 2017 | $5,902 | $159,600 | $0 | $0 |
| 2016 | $5,308 | $159,500 | $0 | $0 |
| 2015 | $13,378 | $144,520 | $0 | $0 |
| 2013 | $12,960 | $139,120 | $0 | $0 |
| 2010 | -- | $120,420 | $45,466 | $74,954 |
Source: Public Records
Map
Nearby Homes
- 370 Roosevelt St
- 50223 Monroe St
- 438 Filmore St
- 326 Province Ln
- 50205 Harding St Unit 246
- 50197 Monroe St Unit 83
- 49651 Shire Ln
- 671 Roosevelt St Unit 60
- 49829 Jackson Ln
- 50509 Coolidge St Unit 428
- 170 Concord Park Dr
- 00000 Denton Rd
- 0000 Denton Rd
- 50540 Paine St
- 51146 Upland View St
- 50272 Hedgewood Dr
- 922 Bellwood Ln
- 50284 Hedgewood Dr
- 783 Prospect Hill St
- 483 Prospect Hill St
- 401 Roosevelt St Unit 226
- 411 Roosevelt St Unit 227
- 391 Roosevelt St
- 330 Roosevelt St Unit 131
- 408 Roosevelt St Unit 235
- 400 Roosevelt St
- 421 Roosevelt St Unit 228
- 394 Roosevelt St Unit 237
- 381 Roosevelt St Unit 224
- 416 Roosevelt St Unit 234
- 390 Roosevelt St
- 424 Roosevelt St Unit 233
- 431 Roosevelt St Unit 229
- 361 Roosevelt St Unit 223
- 432 Roosevelt St Unit 232
- 49922 Harding St
- 350 Roosevelt St
- 350 Roosevelt St Unit 132
- 360 Roosevelt St Unit Bldg-Unit
- 360 Roosevelt St Unit 133