K
Seller's Agent in 2026
Kaytlin Peace
Chalk Realty LLC
(918) 497-8809
1 in this area
1 Total Sale
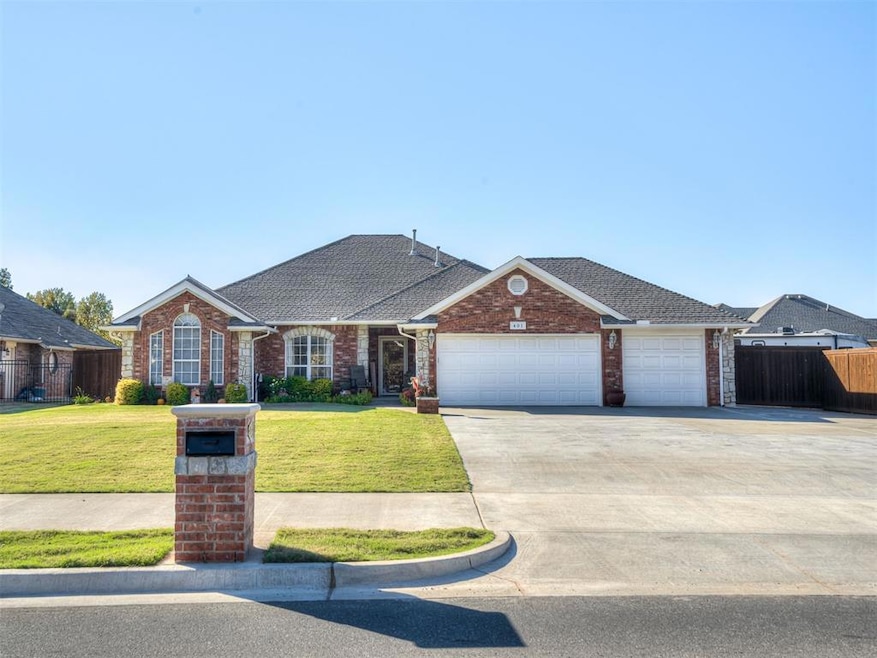


Discover the perfect blend of space, comfort, and convenience in Moore! Nestled on an oversized .61-acre lot, this beautifully maintained 4-bedroom, 2-bath home offers a country feel that’s just minutes away from city amenities. Inside you’ll find a charming kitchen featuring granite countertops that extend up the wall as backsplash, a gas range, and plenty of countertop space for cooking and entertaining. The dedicated formal dining room showcases large windows and crown molding detail. The oversized living room is anchored by a cozy brick fireplace surrounded by wood built ins for extra storage space and a stunning tray ceiling featuring woodwork detail. There is an extra enclosed patio that has been converted to living space and also features a hot tub - perfect for enjoying year round. Outside you will find a true oasis that includes plenty of entertaining areas to include multiple covered seating areas, an underground storm shelter conveniently located on the patio, an outdoor fireplace that’s perfect for cooler nights, and even a complete outdoor kitchen! The property also includes a sprinkler system. For the hobbyist or business owner, the property features an impressive 40x45 climate-controlled shop complete with electric, HVAC, a sink and dishwasher, and a half-bath. A hydraulic gate provides access to the backyard equipped with an additional concrete pad, ideal for projects, equipment, or RV parking, along with an 8x10 storage building for extra storage. (Commercial car lift and air compressor in shop are negotiable with contract) Enjoy country living with all the conveniences of Moore - just minutes from schools, shopping, and highway access. This property truly offers it all! This is a must see!!!
Last Agent to Sell the Property
Chalk Realty LLC License #211437 Listed on: 11/06/2025
We collect this data history from publicly available records. To have your information removed, we recommend requesting removal directly through your county’s website.
| Date | Type | Sale Price | Title Company |
|---|---|---|---|
| Warranty Deed | $565,000 | Legacy Title Of Oklahoma | |
| Warranty Deed | $6,000 | Fa | |
| Warranty Deed | $185,000 | Guaranty Title Company | |
| Quit Claim Deed | -- | None Available | |
| Quit Claim Deed | -- | None Available |
We collect this data history from publicly available records. To have your information removed, we recommend requesting removal directly through your county’s website.
| Date | Status | Loan Amount | Loan Type |
|---|---|---|---|
| Open | $452,000 | New Conventional | |
| Previous Owner | $181,649 | FHA |
| Date | Event | Price | List to Sale | Price per Sq Ft |
|---|---|---|---|---|
| 04/07/2026 04/07/26 | Sold | $565,000 | -0.9% | $216 / Sq Ft |
| 02/17/2026 02/17/26 | Pending | -- | -- | -- |
| 01/15/2026 01/15/26 | Price Changed | $570,000 | -1.7% | $218 / Sq Ft |
| 11/06/2025 11/06/25 | For Sale | $580,000 | -- | $222 / Sq Ft |
| Year | Tax Paid | Tax Assessment Tax Assessment Total Assessment is a certain percentage of the fair market value that is determined by local assessors to be the total taxable value of land and additions on the property. | Land | Improvement |
|---|---|---|---|---|
| 2025 | $2,879 | $24,514 | $4,055 | $20,459 |
| 2024 | $2,766 | $23,800 | $4,397 | $19,403 |
| 2023 | $2,695 | $23,107 | $4,389 | $18,718 |
| 2022 | $2,487 | $21,101 | $4,678 | $16,423 |
| 2021 | $2,546 | $20,487 | $3,600 | $16,887 |
| 2020 | $2,547 | $20,487 | $3,600 | $16,887 |
| 2019 | $2,594 | $20,487 | $3,600 | $16,887 |
| 2018 | $2,594 | $20,487 | $3,600 | $16,887 |
| 2017 | $2,609 | $20,487 | $0 | $0 |
| 2016 | $2,627 | $20,487 | $3,600 | $16,887 |
| 2015 | $2,377 | $20,487 | $3,600 | $16,887 |
| 2014 | $2,502 | $21,070 | $3,600 | $17,470 |
K
Seller's Agent in 2026
Kaytlin Peace
Chalk Realty LLC
(918) 497-8809
1 in this area
1 Total Sale
Source: MLSOK
MLS Number: 1199807
APN: R0095394
Disclaimer: Certain information contained herein is derived from information provided by parties other than Homes.com. All information provided is deemed reliable, but is not guaranteed to be accurate and should be independently verified.
![]() All data is obtained from various sources and may not have been verified by broker or MLS GRID. Supplied Open House Information is subject to change without notice. All information should be independently reviewed and verified for accuracy. Properties may or may not be listed by the office/agent presenting the information. Some IDX listings have been excluded from this website. IDX information is provided exclusively for personal, non-commercial use, and may not be used for any purpose other than to identify prospective properties consumers may be interested in purchasing.
All data is obtained from various sources and may not have been verified by broker or MLS GRID. Supplied Open House Information is subject to change without notice. All information should be independently reviewed and verified for accuracy. Properties may or may not be listed by the office/agent presenting the information. Some IDX listings have been excluded from this website. IDX information is provided exclusively for personal, non-commercial use, and may not be used for any purpose other than to identify prospective properties consumers may be interested in purchasing.
Information is deemed reliable but not guaranteed.
This information is not verified for authenticity or accuracy, is not guaranteed and may not reflect all real estate activity in the market.
Copyright 2026 MLSOK, Inc. All rights reserved.
Listings courtesy of MLSOK as distributed by MLS GRID.
Based on information submitted to the MLS GRID
Ask me questions while you tour the home.
