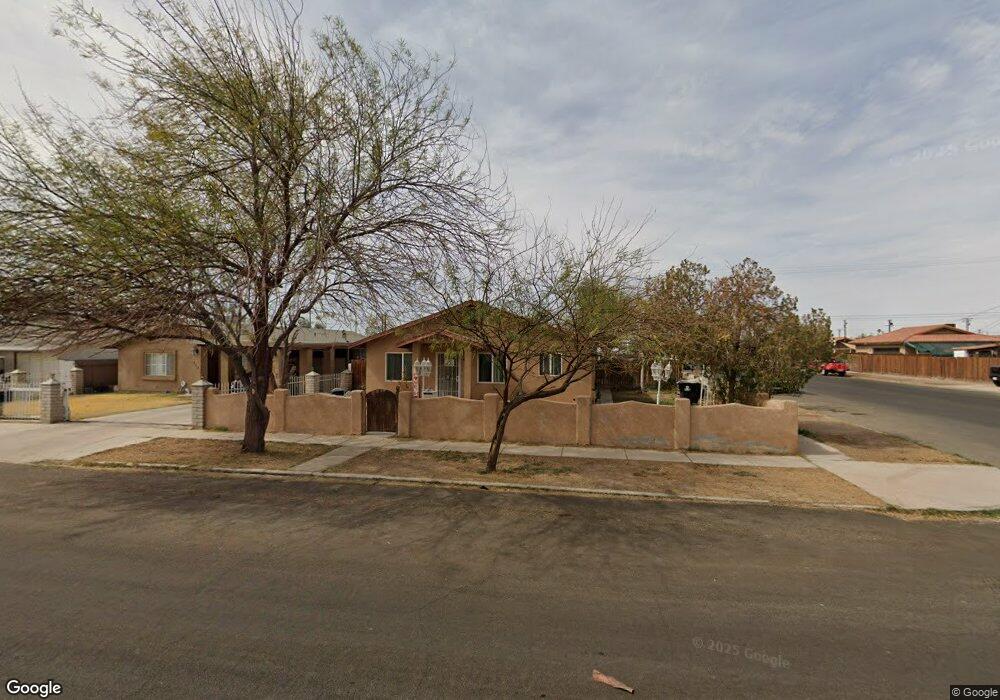
401 S G St Imperial, CA 92251
Estimated Value: $317,501 - $342,000
3
Beds
2
Baths
1,080
Sq Ft
$305/Sq Ft
Est. Value
About This Home
This home is located at 401 S G St, Imperial, CA 92251 and is currently estimated at $329,875, approximately $305 per square foot. 401 S G St is a home located in Imperial County with nearby schools including Ben Hulse Elementary School, Frank M. Wright Middle School, and Imperial High School.
Ownership History
Date
Name
Owned For
Owner Type
Purchase Details
Closed on
Jun 26, 2024
Sold by
Vaughan Frances B
Bought by
Vaughan Frances B and Vaughan Jacqueline A
Current Estimated Value
Purchase Details
Closed on
Feb 8, 2024
Sold by
Vaughan Frances B
Bought by
Vaughan Frances B and Vaughan Jacqueline A
Purchase Details
Closed on
Jan 26, 2007
Sold by
Arballo Jacqueline A
Bought by
Vaughan Frances B
Home Financials for this Owner
Home Financials are based on the most recent Mortgage that was taken out on this home.
Original Mortgage
$42,000
Interest Rate
6.11%
Mortgage Type
Purchase Money Mortgage
Purchase Details
Closed on
Dec 7, 2006
Sold by
Vaughan Frances B
Bought by
Vaughan Frances B and Arballo Jacqueline A
Home Financials for this Owner
Home Financials are based on the most recent Mortgage that was taken out on this home.
Original Mortgage
$42,000
Interest Rate
6.11%
Mortgage Type
Purchase Money Mortgage
Create a Home Valuation Report for This Property
The Home Valuation Report is an in-depth analysis detailing your home's value as well as a comparison with similar homes in the area
Purchase History
| Date | Buyer | Sale Price | Title Company |
|---|---|---|---|
| Vaughan Frances B | -- | None Listed On Document | |
| Vaughan Frances B | -- | None Listed On Document | |
| Vaughan Frances B | -- | Chicago Title Co | |
| Vaughan Frances B | -- | None Available |
Source: Public Records
Mortgage History
| Date | Status | Borrower | Loan Amount |
|---|---|---|---|
| Previous Owner | Vaughan Frances B | $42,000 |
Source: Public Records
Tax History
| Year | Tax Paid | Tax Assessment Tax Assessment Total Assessment is a certain percentage of the fair market value that is determined by local assessors to be the total taxable value of land and additions on the property. | Land | Improvement |
|---|---|---|---|---|
| 2025 | $1,316 | $127,439 | $18,471 | $108,968 |
| 2023 | $1,316 | $122,492 | $17,754 | $104,738 |
| 2022 | $1,285 | $120,091 | $17,406 | $102,685 |
| 2021 | $1,264 | $117,737 | $17,065 | $100,672 |
| 2020 | $1,250 | $116,531 | $16,891 | $99,640 |
| 2019 | $1,232 | $114,247 | $16,560 | $97,687 |
| 2018 | $1,214 | $112,008 | $16,236 | $95,772 |
| 2017 | $1,142 | $109,813 | $15,918 | $93,895 |
| 2016 | $1,100 | $107,660 | $15,606 | $92,054 |
| 2015 | -- | $106,044 | $15,372 | $90,672 |
| 2014 | -- | $103,967 | $15,071 | $88,896 |
Source: Public Records
Map
Nearby Homes
Your Personal Tour Guide
Ask me questions while you tour the home.