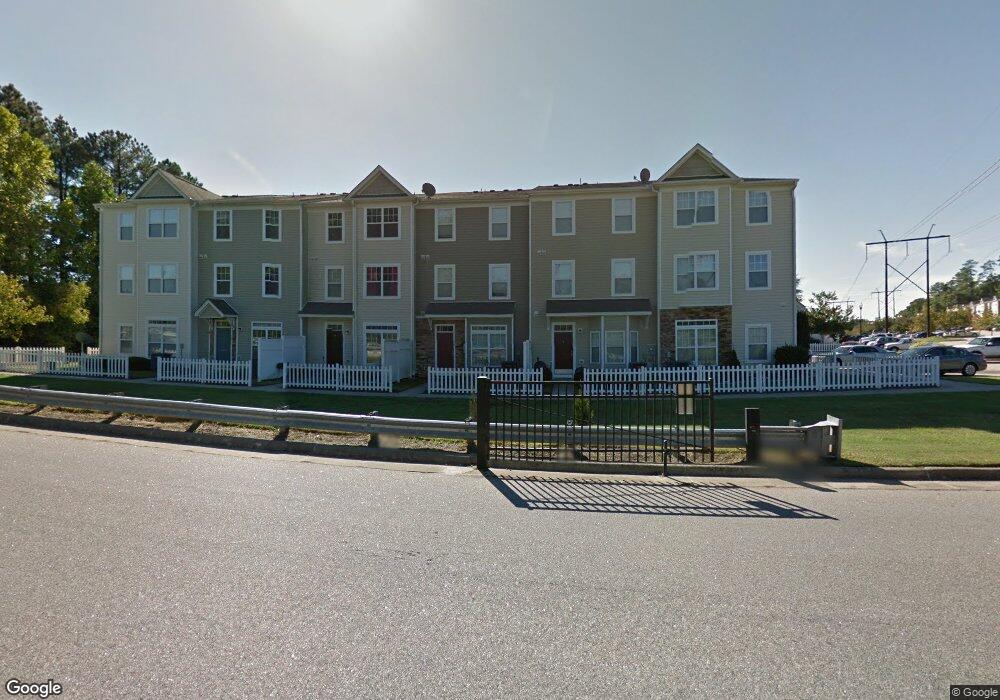
401 Scripps Ln Unit 109 Raleigh, NC 27610
Southeast Raleigh NeighborhoodEstimated Value: $236,414 - $245,000
3
Beds
3
Baths
1,690
Sq Ft
$142/Sq Ft
Est. Value
About This Home
This home is located at 401 Scripps Ln Unit 109, Raleigh, NC 27610 and is currently estimated at $240,604, approximately $142 per square foot. 401 Scripps Ln Unit 109 is a home located in Wake County with nearby schools including Rogers Lane Elementary, River Bend Middle, and Southeast Raleigh Magnet High School.
Ownership History
Date
Name
Owned For
Owner Type
Purchase Details
Closed on
Jun 24, 2016
Sold by
Bethea Tia Mclaurin and Bethea Rodriguis Dealbert
Bought by
Lassiter Carolyn
Current Estimated Value
Home Financials for this Owner
Home Financials are based on the most recent Mortgage that was taken out on this home.
Original Mortgage
$120,500
Outstanding Balance
$95,905
Interest Rate
3.57%
Mortgage Type
New Conventional
Estimated Equity
$144,699
Purchase Details
Closed on
Mar 26, 2008
Sold by
Tidewater Land Llc
Bought by
Mclaurin Tia Renee
Home Financials for this Owner
Home Financials are based on the most recent Mortgage that was taken out on this home.
Original Mortgage
$114,400
Interest Rate
5.68%
Mortgage Type
Unknown
Create a Home Valuation Report for This Property
The Home Valuation Report is an in-depth analysis detailing your home's value as well as a comparison with similar homes in the area
Home Values in the Area
Average Home Value in this Area
Purchase History
| Date | Buyer | Sale Price | Title Company |
|---|---|---|---|
| Lassiter Carolyn | $121,000 | None Available | |
| Mclaurin Tia Renee | $120,500 | None Available |
Source: Public Records
Mortgage History
| Date | Status | Borrower | Loan Amount |
|---|---|---|---|
| Open | Lassiter Carolyn | $120,500 | |
| Previous Owner | Mclaurin Tia Renee | $114,400 |
Source: Public Records
Tax History Compared to Growth
Tax History
| Year | Tax Paid | Tax Assessment Tax Assessment Total Assessment is a certain percentage of the fair market value that is determined by local assessors to be the total taxable value of land and additions on the property. | Land | Improvement |
|---|---|---|---|---|
| 2025 | $2,242 | $254,837 | $40,000 | $214,837 |
| 2024 | $2,233 | $254,837 | $40,000 | $214,837 |
| 2023 | $1,665 | $150,955 | $20,000 | $130,955 |
| 2022 | $1,548 | $150,955 | $20,000 | $130,955 |
| 2021 | $1,489 | $150,955 | $20,000 | $130,955 |
| 2020 | $1,462 | $150,955 | $20,000 | $130,955 |
| 2019 | $1,325 | $112,609 | $18,000 | $94,609 |
| 2018 | $1,250 | $112,609 | $18,000 | $94,609 |
| 2017 | $1,191 | $112,609 | $18,000 | $94,609 |
| 2016 | $1,167 | $112,609 | $18,000 | $94,609 |
| 2015 | $1,314 | $124,936 | $24,000 | $100,936 |
| 2014 | $1,247 | $124,936 | $24,000 | $100,936 |
Source: Public Records
Map
Nearby Homes
- 401 Scripps Ln Unit 104
- 311 Gilman Ln Unit 107
- 300 Gilman Ln Unit 101
- 5430 Neuse Ridge Rd
- 5310 Heather Ridge Ln
- 5165 Busted Rock Trail
- 108 Penncross Dr
- 5301 Daleview Dr
- 5011 Peachtree Town Ln
- 5204 Bentgrass Dr
- 75 Wellington Dr
- 701 Thistlegate Trail
- 5800 Brookshadow Dr
- 801 Falling Wind Ct
- 804 Falling Wind Ct
- 1200 Hardin Hill Ln
- 1208 Hardin Hill Ln
- 1212 Hardin Hill Ln
- 1216 Hardin Hill Ln
- 821 White Daisies Ct
- 401 Scripps Ln Unit 110
- 401 Scripps Ln Unit 111
- 401 Scripps Ln Unit 107
- 401 Scripps Ln Unit 106
- 401 Scripps Ln Unit 108
- 401 Scripps Ln Unit 105
- 401 Scripps Ln Unit 103
- 401 Scripps Ln Unit 101
- 401 Scripps Ln Unit 100
- 401 Scripps Ln Unit 102
- 401 Scripps Ln
- 350 Gilman Ln Unit 105
- 350 Gilman Ln Unit 106
- 350 Gilman Ln Unit 107
- 350 Gilman Ln Unit 103
- 350 Gilman Ln Unit 108
- 350 Gilman Ln Unit 102
- 350 Gilman Ln Unit 109
- 350 Gilman Ln Unit 101
- 350 Gilman Ln Unit 110