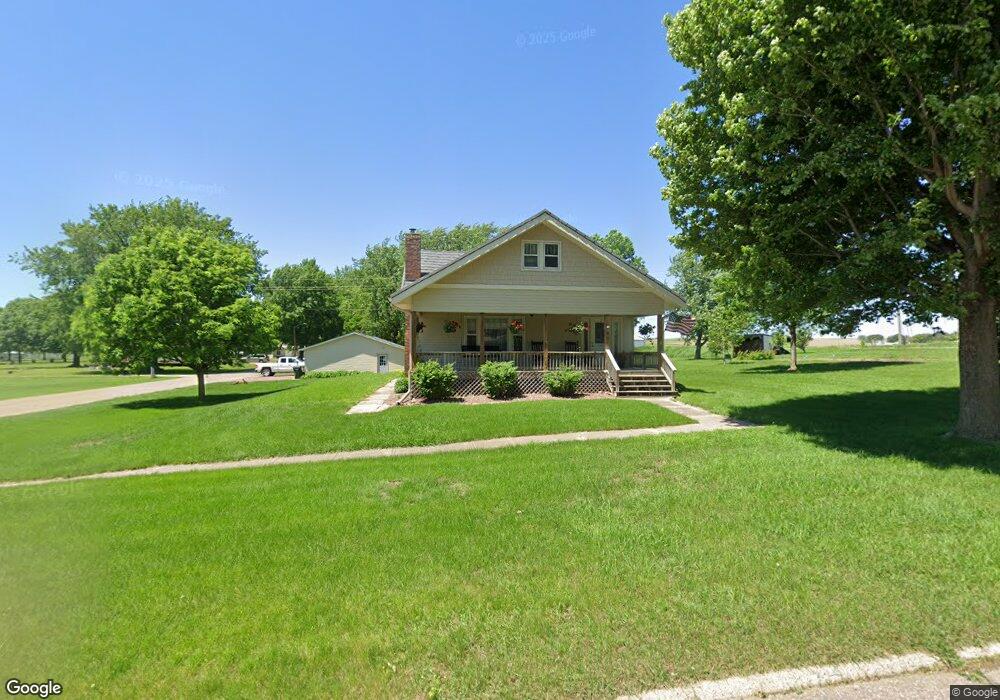
401 Thomas St Danbury, IA 51019
Estimated Value: $88,000 - $119,000
3
Beds
1
Bath
1,863
Sq Ft
$57/Sq Ft
Est. Value
About This Home
This home is located at 401 Thomas St, Danbury, IA 51019 and is currently estimated at $106,937, approximately $57 per square foot. 401 Thomas St is a home located in Woodbury County with nearby schools including Mapleton Elementary School, Mvao Middle School, and Maple Valley-Anthon Oto High School.
Ownership History
Date
Name
Owned For
Owner Type
Purchase Details
Closed on
Mar 4, 2011
Sold by
Hieber Denita K
Bought by
Flammang Eric Paul and Flammang Tiffany Rose
Current Estimated Value
Home Financials for this Owner
Home Financials are based on the most recent Mortgage that was taken out on this home.
Original Mortgage
$75,000
Outstanding Balance
$51,321
Interest Rate
4.78%
Mortgage Type
Credit Line Revolving
Estimated Equity
$55,616
Create a Home Valuation Report for This Property
The Home Valuation Report is an in-depth analysis detailing your home's value as well as a comparison with similar homes in the area
Home Values in the Area
Average Home Value in this Area
Purchase History
| Date | Buyer | Sale Price | Title Company |
|---|---|---|---|
| Flammang Eric Paul | $45,000 | None Available |
Source: Public Records
Mortgage History
| Date | Status | Borrower | Loan Amount |
|---|---|---|---|
| Open | Flammang Eric Paul | $75,000 |
Source: Public Records
Tax History Compared to Growth
Tax History
| Year | Tax Paid | Tax Assessment Tax Assessment Total Assessment is a certain percentage of the fair market value that is determined by local assessors to be the total taxable value of land and additions on the property. | Land | Improvement |
|---|---|---|---|---|
| 2025 | $1,132 | $87,970 | $7,000 | $80,970 |
| 2024 | $1,132 | $83,020 | $7,000 | $76,020 |
| 2023 | $868 | $83,020 | $7,000 | $76,020 |
| 2022 | $810 | $57,820 | $7,000 | $50,820 |
| 2021 | $810 | $57,820 | $7,000 | $50,820 |
| 2020 | $916 | $60,050 | $7,490 | $52,560 |
| 2019 | $924 | $60,050 | $7,490 | $52,560 |
| 2018 | $908 | $60,050 | $7,490 | $52,560 |
| 2017 | $908 | $60,050 | $7,490 | $52,560 |
| 2016 | $930 | $60,050 | $0 | $0 |
| 2015 | $867 | $56,120 | $7,000 | $49,120 |
| 2014 | $866 | $56,120 | $7,000 | $49,120 |
Source: Public Records
Map
Nearby Homes