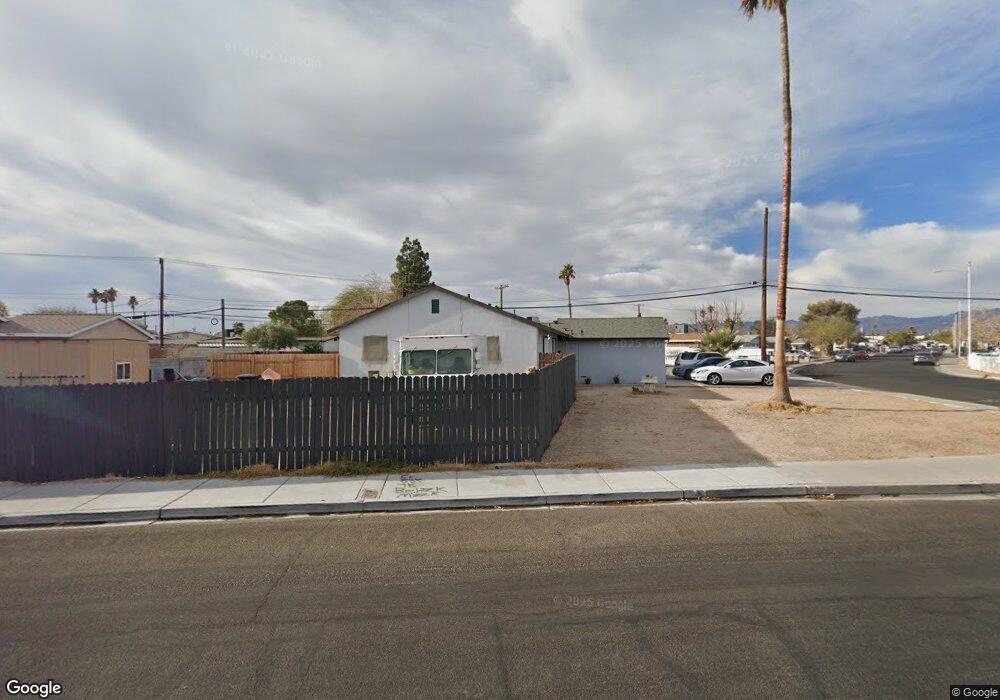
401 Wisteria Ave Las Vegas, NV 89107
Buffalo NeighborhoodEstimated Value: $340,000 - $412,000
3
Beds
2
Baths
1,200
Sq Ft
$315/Sq Ft
Est. Value
About This Home
This home is located at 401 Wisteria Ave, Las Vegas, NV 89107 and is currently estimated at $378,460, approximately $315 per square foot. 401 Wisteria Ave is a home located in Clark County with nearby schools including Red Rock Elementary School, Frank F Garside Junior High School, and Western High School.
Ownership History
Date
Name
Owned For
Owner Type
Purchase Details
Closed on
Mar 14, 2023
Sold by
Rivera Victor M and Rivera Leticia
Bought by
Victor M Rivera And Leticia Rivera Revocable
Current Estimated Value
Purchase Details
Closed on
Jun 12, 2014
Sold by
Pipi Trust
Bought by
Rivera Victor
Home Financials for this Owner
Home Financials are based on the most recent Mortgage that was taken out on this home.
Original Mortgage
$106,043
Interest Rate
4.25%
Mortgage Type
FHA
Purchase Details
Closed on
Aug 19, 2008
Sold by
Prediger James J and Prediger Vickie L
Bought by
Prediger James J and Prediger Vickie
Purchase Details
Closed on
May 29, 1998
Sold by
Prediger James J and Prediger Vickie L
Bought by
Prediger James J and Prediger Vickie L
Home Financials for this Owner
Home Financials are based on the most recent Mortgage that was taken out on this home.
Original Mortgage
$81,750
Interest Rate
7.1%
Create a Home Valuation Report for This Property
The Home Valuation Report is an in-depth analysis detailing your home's value as well as a comparison with similar homes in the area
Home Values in the Area
Average Home Value in this Area
Purchase History
| Date | Buyer | Sale Price | Title Company |
|---|---|---|---|
| Victor M Rivera And Leticia Rivera Revocable | -- | -- | |
| Rivera Victor | $108,000 | Lawyers Title | |
| Prediger James J | -- | None Available | |
| Prediger James J | -- | Lawyers Title |
Source: Public Records
Mortgage History
| Date | Status | Borrower | Loan Amount |
|---|---|---|---|
| Previous Owner | Rivera Victor | $106,043 | |
| Previous Owner | Prediger James J | $81,750 |
Source: Public Records
Tax History Compared to Growth
Tax History
| Year | Tax Paid | Tax Assessment Tax Assessment Total Assessment is a certain percentage of the fair market value that is determined by local assessors to be the total taxable value of land and additions on the property. | Land | Improvement |
|---|---|---|---|---|
| 2025 | $1,204 | $63,848 | $37,345 | $26,503 |
| 2024 | $1,115 | $63,848 | $37,345 | $26,503 |
| 2023 | $1,115 | $58,046 | $34,265 | $23,781 |
| 2022 | $1,033 | $48,676 | $27,335 | $21,341 |
| 2021 | $957 | $45,243 | $25,410 | $19,833 |
| 2020 | $885 | $44,293 | $25,025 | $19,268 |
| 2019 | $830 | $39,359 | $20,790 | $18,569 |
| 2018 | $792 | $33,669 | $16,100 | $17,569 |
| 2017 | $1,043 | $31,825 | $14,350 | $17,475 |
| 2016 | $742 | $28,336 | $11,550 | $16,786 |
| 2015 | $740 | $25,015 | $8,750 | $16,265 |
| 2014 | $717 | $21,209 | $5,600 | $15,609 |
Source: Public Records
Map
Nearby Homes
- 417 Wisteria Ave
- 360 Wisteria Ave
- 340 Zion Dr
- 5613 Idle Ave
- 329 Wisteria Ave
- 709 Evergreen Cir
- 332 S Mallard St
- 5705 Evergreen Ave
- 494 Fallwood Ln
- 429 Mill Hollow Rd
- 309 Wisteria Ave
- 800 Antonio Dr
- 6100 Alamo Cir
- 5900 Concert Dr
- 468 Fallwood Ln
- 5425 Evergreen Ave
- 809 Upland Blvd
- 257 Colleen Dr
- 228 Falcon Ln
- 5326 Evergreen Ave
- 5702 Shawnee Ave
- 405 Wisteria Ave
- 409 Wisteria Ave
- 5704 Shawnee Ave
- 404 Wisteria Ave
- 5620 Alta Dr
- 400 Wisteria Ave
- 5700 Alta Dr
- 389 Wisteria Ave
- 5701 Shawnee Ave
- 5616 Alta Dr
- 5704 Alta Dr
- 392 Wisteria Ave
- 415 Wisteria Ave
- 5708 Shawnee Ave
- 5612 Alta Dr
- 388 Wisteria Ave
- 5707 Shawnee Ave
- 5708 Alta Dr
- 405 Upland Blvd