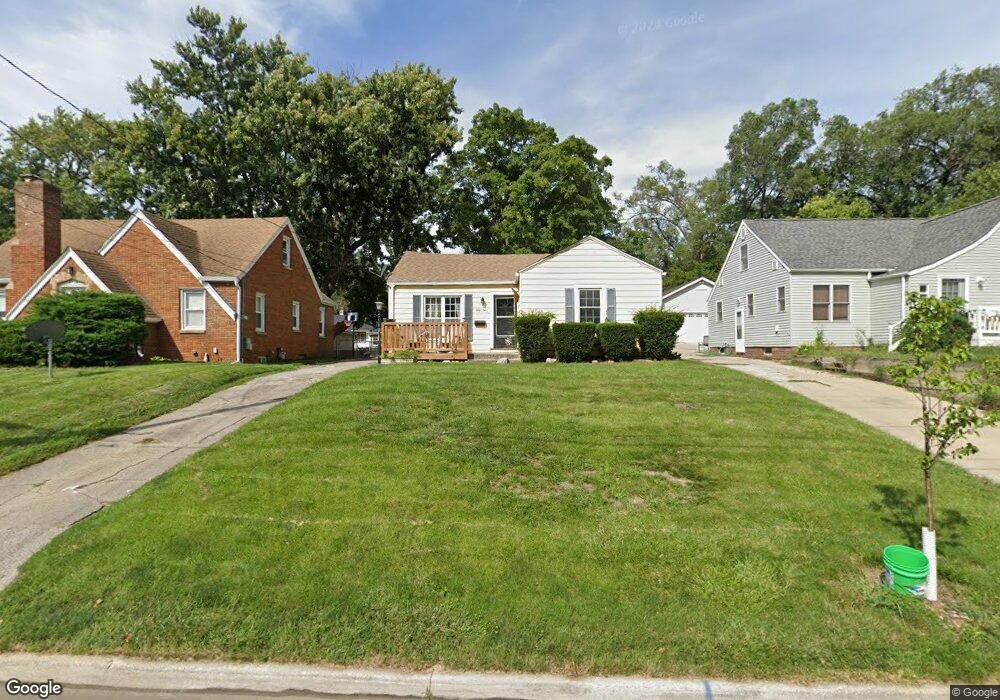
4010 12th St Des Moines, IA 50313
Oak Park NeighborhoodEstimated Value: $178,000 - $200,000
3
Beds
1
Bath
1,092
Sq Ft
$173/Sq Ft
Est. Value
About This Home
This home is located at 4010 12th St, Des Moines, IA 50313 and is currently estimated at $188,975, approximately $173 per square foot. 4010 12th St is a home located in Polk County with nearby schools including Oak Park Elementary School, Harding Middle School, and North High School.
Ownership History
Date
Name
Owned For
Owner Type
Purchase Details
Closed on
Mar 23, 2005
Sold by
Peck Roger L and Peck Diane Vilks
Bought by
Peck Roger L
Current Estimated Value
Purchase Details
Closed on
Oct 30, 2001
Sold by
Nall Jerry Wayne and Nall Sheila
Bought by
Principal Residential Mtg Inc
Create a Home Valuation Report for This Property
The Home Valuation Report is an in-depth analysis detailing your home's value as well as a comparison with similar homes in the area
Home Values in the Area
Average Home Value in this Area
Purchase History
| Date | Buyer | Sale Price | Title Company |
|---|---|---|---|
| Peck Roger L | -- | -- | |
| Principal Residential Mtg Inc | $54,641 | -- |
Source: Public Records
Tax History
| Year | Tax Paid | Tax Assessment Tax Assessment Total Assessment is a certain percentage of the fair market value that is determined by local assessors to be the total taxable value of land and additions on the property. | Land | Improvement |
|---|---|---|---|---|
| 2025 | $2,730 | $190,800 | $29,700 | $161,100 |
| 2024 | $2,730 | $156,250 | $25,800 | $130,450 |
| 2023 | $2,708 | $168,100 | $25,800 | $142,300 |
| 2022 | $2,684 | $135,600 | $21,800 | $113,800 |
| 2021 | $2,526 | $135,600 | $21,800 | $113,800 |
| 2020 | $2,620 | $121,700 | $19,500 | $102,200 |
| 2019 | $2,500 | $121,700 | $19,500 | $102,200 |
| 2018 | $2,510 | $113,400 | $17,700 | $95,700 |
| 2017 | $2,320 | $103,100 | $17,700 | $85,400 |
| 2016 | $2,256 | $94,300 | $15,900 | $78,400 |
| 2015 | $2,256 | $94,300 | $15,900 | $78,400 |
| 2014 | $2,086 | $90,400 | $15,000 | $75,400 |
Source: Public Records
Map
Nearby Homes
Your Personal Tour Guide
Ask me questions while you tour the home.