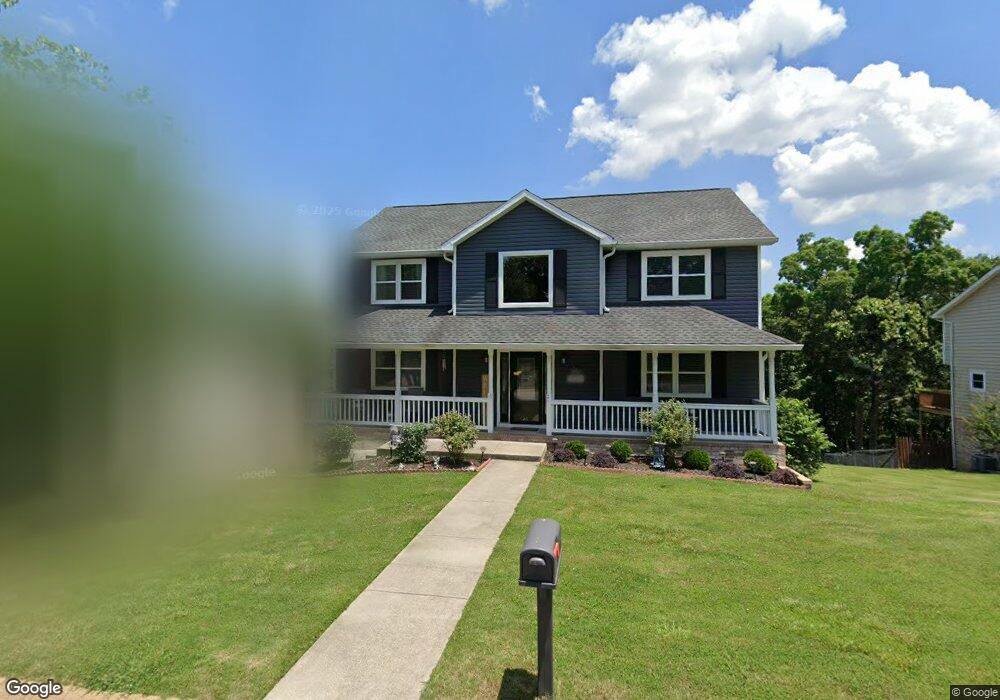
4010 Banner Crest Dr Unit 11 Ooltewah, TN 37363
Estimated Value: $417,000 - $446,040
--
Bed
3
Baths
2,380
Sq Ft
$182/Sq Ft
Est. Value
About This Home
This home is located at 4010 Banner Crest Dr Unit 11, Ooltewah, TN 37363 and is currently estimated at $434,010, approximately $182 per square foot. 4010 Banner Crest Dr Unit 11 is a home located in Hamilton County with nearby schools including Wallace A. Smith Elementary School, Hunter Middle School, and Ooltewah High School.
Ownership History
Date
Name
Owned For
Owner Type
Purchase Details
Closed on
May 10, 2018
Sold by
Vandegriff Matthew F and Vandegriff Erica H
Bought by
Crawford Douglas E and Crawford Sherrie Y
Current Estimated Value
Home Financials for this Owner
Home Financials are based on the most recent Mortgage that was taken out on this home.
Original Mortgage
$228,026
Outstanding Balance
$199,482
Interest Rate
5.12%
Mortgage Type
FHA
Estimated Equity
$234,528
Purchase Details
Closed on
Jul 8, 2011
Sold by
Taylor Landon R and Taylor Pamela H
Bought by
Vandegriff Matthew F and Vandegriff Erica H
Home Financials for this Owner
Home Financials are based on the most recent Mortgage that was taken out on this home.
Original Mortgage
$183,728
Interest Rate
4.62%
Mortgage Type
New Conventional
Purchase Details
Closed on
Sep 27, 1995
Bought by
Taylor Landon R and Taylor Pamela H
Create a Home Valuation Report for This Property
The Home Valuation Report is an in-depth analysis detailing your home's value as well as a comparison with similar homes in the area
Home Values in the Area
Average Home Value in this Area
Purchase History
| Date | Buyer | Sale Price | Title Company |
|---|---|---|---|
| Crawford Douglas E | $235,900 | None Available | |
| Vandegriff Matthew F | $193,400 | Cumberland Title & Guaranty | |
| Taylor Landon R | $135,000 | -- |
Source: Public Records
Mortgage History
| Date | Status | Borrower | Loan Amount |
|---|---|---|---|
| Open | Crawford Douglas E | $228,026 | |
| Previous Owner | Vandegriff Matthew F | $183,728 |
Source: Public Records
Tax History Compared to Growth
Tax History
| Year | Tax Paid | Tax Assessment Tax Assessment Total Assessment is a certain percentage of the fair market value that is determined by local assessors to be the total taxable value of land and additions on the property. | Land | Improvement |
|---|---|---|---|---|
| 2024 | $1,670 | $74,625 | $0 | $0 |
| 2023 | $1,679 | $74,625 | $0 | $0 |
| 2022 | $1,679 | $74,625 | $0 | $0 |
| 2021 | $1,679 | $74,625 | $0 | $0 |
| 2020 | $1,493 | $53,675 | $0 | $0 |
| 2019 | $1,493 | $53,675 | $0 | $0 |
| 2018 | $1,493 | $53,675 | $0 | $0 |
| 2017 | $1,493 | $53,675 | $0 | $0 |
| 2016 | $1,375 | $0 | $0 | $0 |
| 2015 | $1,375 | $49,400 | $0 | $0 |
| 2014 | $1,375 | $0 | $0 | $0 |
Source: Public Records
Map
Nearby Homes
- 6520 Flagstone Dr
- 6514 Flagstone Dr
- 6601 Flagstone Dr
- 3911 Mt Verd Ln
- 6920 Knollcrest Dr
- 6376 Pringle Dr
- 6747 Sawtooth Dr
- 6026 Hunter Valley Rd
- 4133 Flagway Dr
- 4141 Flagway Dr
- 5916 Riley Rd
- 6815 Benwood Dr
- 7015 Lystra Rd
- 6912 Benwood Dr
- 0 Lodestone Dr
- 7242 Garfield Rd
- 6307 Jan Lane Dr
- 7004 Lystra Rd
- 6830 Buck Trail Dr
- 7219 Flagstone Dr
- 4010 Banner Crest Dr
- 4012 Banner Crest Dr
- 4012 Banner Crest Dr Unit 11
- 4006 Banner Crest Dr
- 4004 Banner Crest Dr
- 4016 Banner Crest Unit 11
- 4016 Banner Crest
- 4016 Banner Crest Dr
- 6415 Flag Point Dr
- 4011 Banner Crest Dr
- 0 Banner Crest
- 4015 Banner Crest Dr
- 6512 Flagstone Drive351
- 6506 Flagstone Dr
- 4018 Banner Crest Dr
- 4000 Banner Crest Dr
- 6416 Flag Point Dr
- 6413 Flag Point Dr
- 4017 Banner Crest Dr
- 6508 Flagstone Dr