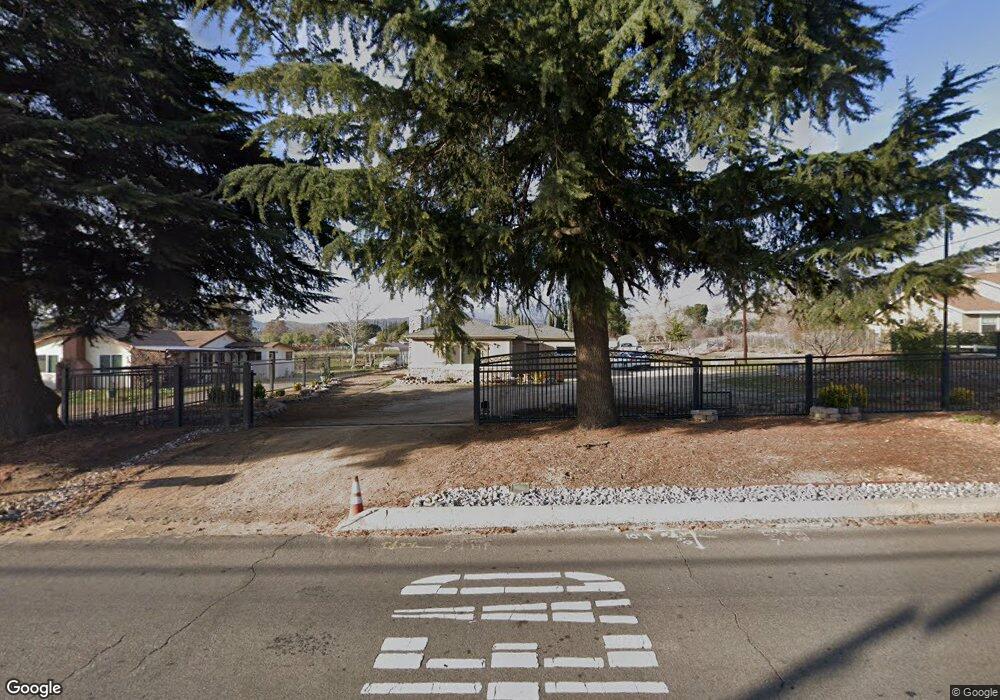
40112 Brookside Ave Cherry Valley, CA 92223
Estimated Value: $209,000 - $376,000
1
Bed
1
Bath
746
Sq Ft
$416/Sq Ft
Est. Value
About This Home
This home is located at 40112 Brookside Ave, Cherry Valley, CA 92223 and is currently estimated at $310,295, approximately $415 per square foot. 40112 Brookside Ave is a home located in Riverside County with nearby schools including Starlight Elementary School, San Gorgonio Middle School, and Beaumont Senior High School.
Ownership History
Date
Name
Owned For
Owner Type
Purchase Details
Closed on
Mar 13, 2025
Sold by
Choi Chong
Bought by
Choi Chong
Current Estimated Value
Purchase Details
Closed on
Mar 8, 2013
Sold by
Dunn Shawn
Bought by
Choi Chong
Purchase Details
Closed on
Mar 1, 2013
Sold by
Dunn Shawn
Bought by
Choi Chong
Purchase Details
Closed on
Jan 7, 2010
Sold by
Sabr Mortgage Loan 2008-1 Reo Subsidiary
Bought by
Dunn Shawn
Purchase Details
Closed on
Nov 4, 2009
Sold by
Sahagun George
Bought by
Sabr Mortgage Loan 2008-1 Reo Subsidiary
Purchase Details
Closed on
Feb 21, 2007
Sold by
Allen L Kathleen
Bought by
Sahagun George
Purchase Details
Closed on
Mar 27, 1996
Sold by
Allen Raymond E and Allen John C
Bought by
Allen Carl N and Allen Miriam J
Home Financials for this Owner
Home Financials are based on the most recent Mortgage that was taken out on this home.
Original Mortgage
$36,000
Interest Rate
8.18%
Create a Home Valuation Report for This Property
The Home Valuation Report is an in-depth analysis detailing your home's value as well as a comparison with similar homes in the area
Home Values in the Area
Average Home Value in this Area
Purchase History
| Date | Buyer | Sale Price | Title Company |
|---|---|---|---|
| Choi Chong | -- | None Listed On Document | |
| Choi Chong | -- | None Available | |
| Choi Chong | -- | None Available | |
| Dunn Shawn | $72,500 | Old Republic Title Company | |
| Sabr Mortgage Loan 2008-1 Reo Subsidiary | $129,168 | None Available | |
| Sahagun George | $239,000 | First American | |
| Allen Carl N | $45,000 | Old Republic Title Company |
Source: Public Records
Mortgage History
| Date | Status | Borrower | Loan Amount |
|---|---|---|---|
| Previous Owner | Allen Carl N | $36,000 |
Source: Public Records
Tax History
| Year | Tax Paid | Tax Assessment Tax Assessment Total Assessment is a certain percentage of the fair market value that is determined by local assessors to be the total taxable value of land and additions on the property. | Land | Improvement |
|---|---|---|---|---|
| 2025 | $1,164 | $93,565 | $45,169 | $48,396 |
| 2023 | $1,164 | $89,934 | $43,416 | $46,518 |
| 2022 | $1,143 | $88,171 | $42,565 | $45,606 |
| 2021 | $1,120 | $86,443 | $41,731 | $44,712 |
| 2020 | $1,106 | $85,558 | $41,304 | $44,254 |
| 2019 | $1,087 | $83,882 | $40,495 | $43,387 |
| 2018 | $1,080 | $82,238 | $39,701 | $42,537 |
| 2017 | $1,060 | $80,626 | $38,923 | $41,703 |
| 2016 | $1,031 | $79,046 | $38,160 | $40,886 |
| 2015 | $1,013 | $77,861 | $37,588 | $40,273 |
| 2014 | $1,011 | $76,337 | $36,852 | $39,485 |
Source: Public Records
Map
Nearby Homes
- 1322 Melstone St
- 10982 Cherry Ave
- 10885 Jonathan Ave
- 1362 Burham Ct
- 11047 Karen Dr
- 1335 Alpine Ave
- 11285 Cherry Ave
- 1672 Milford Way
- 40471 Rome Beauty Way
- 1666 Ocala Ln
- 11345 Sunnyslope Ave
- 1355 Mary Ln
- 1628 Tildon Ct
- 1632 Manti Ct
- 11067 Maureen Dr
- 1587 Milky Way
- 757 Cherry Valley
- 1657 Stone Creek Rd
- 1555 Peridot Ln
- 1569 Taurus Ln
- 40082 Brookside Ave
- 40142 Brookside Ave
- 40076 Brookside Ave
- 1336 Melstone St
- 1326 Melstone St
- 40054 Brookside Ave
- 40200 Brookside Ave
- 10878 Cherry Ave
- 1318 Melstone St
- 10956 Cherry Ave
- 1354 Melstone St
- 1310 Melstone St
- 1331 Melstone St
- 1329 Melstone St
- 1339 Melstone St
- 1335 Melstone St
- 40220 Brookside Ave
- 1325 Melstone St
- 1360 Melstone St
- 1321 Melstone St
Your Personal Tour Guide
Ask me questions while you tour the home.