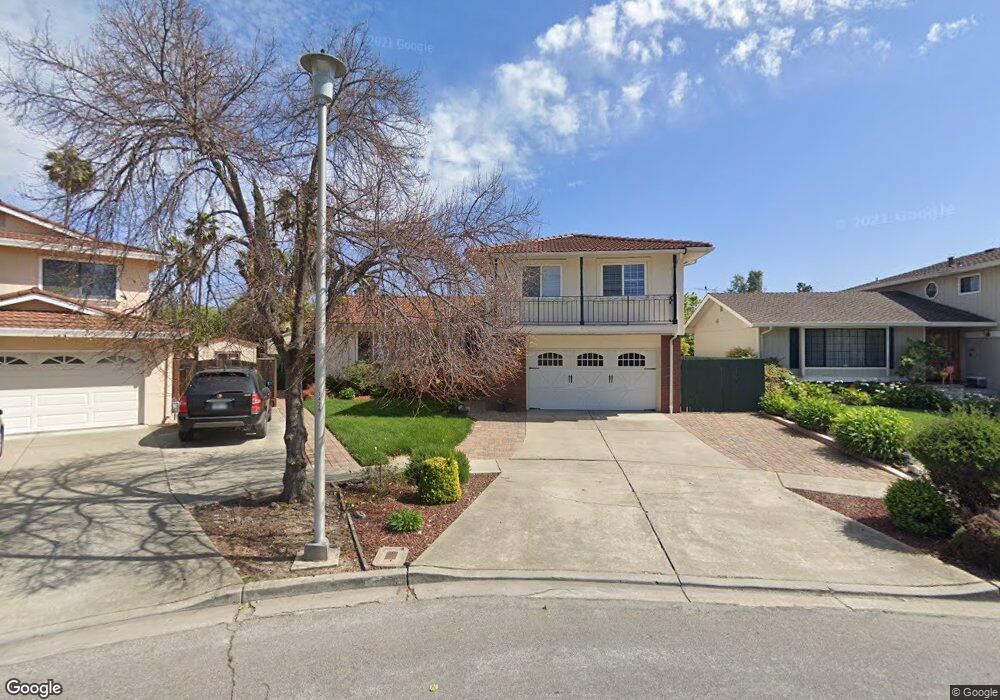
40116 Lucinda Ct Fremont, CA 94539
Kimber-Gomes NeighborhoodEstimated Value: $2,352,000 - $2,739,000
4
Beds
3
Baths
2,251
Sq Ft
$1,119/Sq Ft
Est. Value
About This Home
This home is located at 40116 Lucinda Ct, Fremont, CA 94539 and is currently estimated at $2,519,270, approximately $1,119 per square foot. 40116 Lucinda Ct is a home located in Alameda County with nearby schools including John Gomes Elementary School, William Hopkins Junior High School, and Mission San Jose High School.
Ownership History
Date
Name
Owned For
Owner Type
Purchase Details
Closed on
Dec 13, 2007
Sold by
Dalal Milind P and Dalal Nisha M
Bought by
Dalal Milind P and Dalal Nisha
Current Estimated Value
Purchase Details
Closed on
Sep 2, 2003
Sold by
Yang Samuel C and Yang Connie W
Bought by
Dalal Milind P and Dalal Nisha M
Home Financials for this Owner
Home Financials are based on the most recent Mortgage that was taken out on this home.
Original Mortgage
$615,000
Outstanding Balance
$258,194
Interest Rate
4.87%
Mortgage Type
Purchase Money Mortgage
Estimated Equity
$2,261,076
Purchase Details
Closed on
Jun 5, 2000
Sold by
Rho Byung Y and Rho Yun S
Bought by
Yang Samuel C and Yang Connie W
Home Financials for this Owner
Home Financials are based on the most recent Mortgage that was taken out on this home.
Original Mortgage
$625,000
Interest Rate
8.15%
Mortgage Type
Stand Alone First
Purchase Details
Closed on
Jan 27, 1995
Sold by
Lee Eric V and Lee Dolores
Bought by
Rho Byung Y and Rho Yun S
Home Financials for this Owner
Home Financials are based on the most recent Mortgage that was taken out on this home.
Original Mortgage
$300,000
Interest Rate
5.75%
Create a Home Valuation Report for This Property
The Home Valuation Report is an in-depth analysis detailing your home's value as well as a comparison with similar homes in the area
Home Values in the Area
Average Home Value in this Area
Purchase History
| Date | Buyer | Sale Price | Title Company |
|---|---|---|---|
| Dalal Milind P | -- | None Available | |
| Dalal Milind P | $769,000 | Commonwealth Land Title Co | |
| Yang Samuel C | $725,000 | Old Republic Title Company | |
| Rho Byung Y | $340,000 | American Title Insurance Co |
Source: Public Records
Mortgage History
| Date | Status | Borrower | Loan Amount |
|---|---|---|---|
| Open | Dalal Milind P | $615,000 | |
| Previous Owner | Yang Samuel C | $625,000 | |
| Previous Owner | Rho Byung Y | $300,000 |
Source: Public Records
Tax History Compared to Growth
Tax History
| Year | Tax Paid | Tax Assessment Tax Assessment Total Assessment is a certain percentage of the fair market value that is determined by local assessors to be the total taxable value of land and additions on the property. | Land | Improvement |
|---|---|---|---|---|
| 2025 | $13,172 | $1,111,748 | $328,415 | $790,333 |
| 2024 | $13,172 | $1,089,817 | $321,977 | $774,840 |
| 2023 | $12,825 | $1,075,311 | $315,663 | $759,648 |
| 2022 | $12,669 | $1,047,230 | $309,475 | $744,755 |
| 2021 | $12,355 | $1,026,566 | $303,409 | $730,157 |
| 2020 | $12,424 | $1,022,974 | $300,300 | $722,674 |
| 2019 | $12,279 | $1,002,916 | $294,411 | $708,505 |
| 2018 | $12,041 | $983,252 | $288,639 | $694,613 |
| 2017 | $11,739 | $963,972 | $282,979 | $680,993 |
| 2016 | $11,544 | $945,071 | $277,431 | $667,640 |
| 2015 | $11,396 | $930,875 | $273,263 | $657,612 |
| 2014 | $11,204 | $912,643 | $267,911 | $644,732 |
Source: Public Records
Map
Nearby Homes
- 40613 Encanto Way
- 40743 Rainwater Ct Unit 80
- 39478 Zacate Ave
- 1401 Lemos Ln
- 260 Jacaranda Dr
- 39331 Marbella Terraza
- 39285 Marbella Terraza Unit 9P
- 1123 Farragut Dr
- 1910 Barrymore Common Unit C
- 1962 Briscoe Terrace
- 1960 Barrymore Common Unit K
- 41246 Mission Blvd
- 39199 Guardino Dr Unit 170
- 39199 Guardino Dr Unit 371
- 39199 Guardino Dr Unit 179
- 39239 Walnut Terrace
- 41252 Mission Blvd
- 39149 Guardino Dr Unit 247
- 41043 Joyce Ave
- 874 Cherry Glen Cir Unit 111
- 40124 Lucinda Ct
- 40110 Lucinda Ct
- 40184 San Carlos Place
- 40130 Lucinda Ct
- 40178 San Carlos Place
- 40190 San Carlos Place
- 40125 Lucinda Ct
- 40172 San Carlos Place
- 40136 Lucinda Ct
- 40196 San Carlos Place
- 40160 San Carlos Place
- 40103 Catalina Place
- 40135 Lucinda Ct
- 40142 Lucinda Ct Unit 3
- 40197 San Carlos Place
- 40092 Catalina Place
- 40282 San Sebastian Place
- 40143 Lucinda Ct
- 40171 San Carlos Place
- 40266 San Sebastian Place