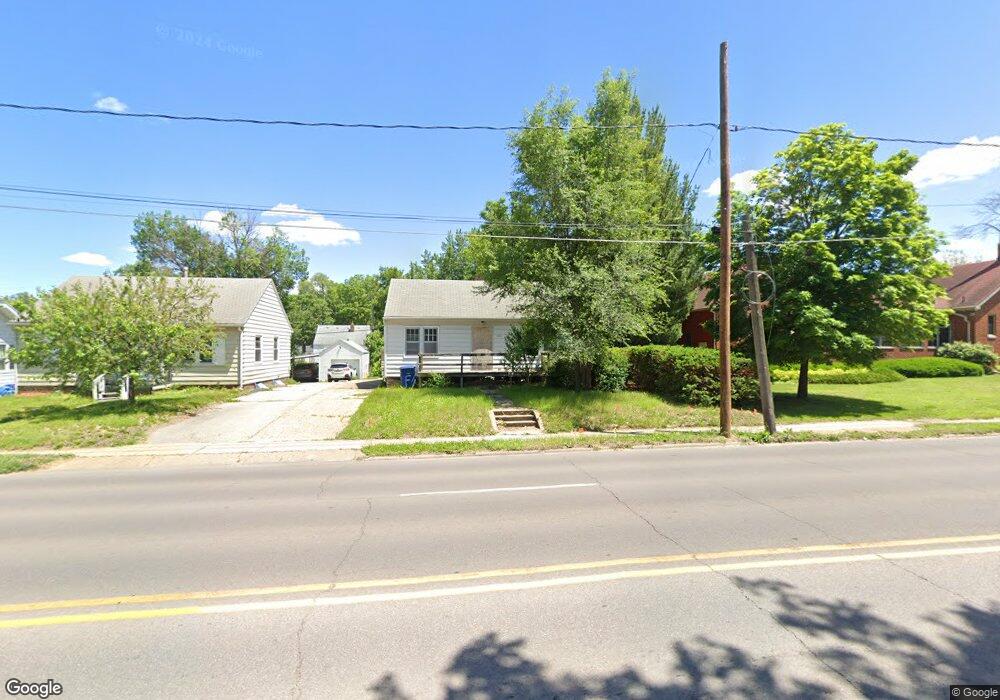
4013 2nd Ave Des Moines, IA 50313
Highland Park NeighborhoodEstimated Value: $132,695 - $174,000
2
Beds
1
Bath
790
Sq Ft
$185/Sq Ft
Est. Value
About This Home
This home is located at 4013 2nd Ave, Des Moines, IA 50313 and is currently estimated at $145,924, approximately $184 per square foot. 4013 2nd Ave is a home located in Polk County with nearby schools including Madison Elementary School, Harding Middle School, and North High School.
Ownership History
Date
Name
Owned For
Owner Type
Purchase Details
Closed on
Jun 27, 2025
Sold by
Polk County Treasurer
Bought by
Muskie Holdings Llc
Current Estimated Value
Purchase Details
Closed on
Apr 26, 2017
Sold by
Deutsche Bank National Trust Co
Bought by
Delude Chris
Purchase Details
Closed on
Oct 18, 2016
Sold by
Huckaby Billy and Huckaby Billy J
Bought by
Deutsche Bank National Trust and Argent Securities Inc
Purchase Details
Closed on
Jan 10, 2013
Sold by
The Estate Of Margaret Huckaby
Bought by
Huckaby Billy J
Purchase Details
Closed on
Mar 26, 2004
Sold by
Huckaby Margaret Mary and Reineke Margaret Mary
Bought by
Huckaby Billy and Huckaby Margaret Mary
Home Financials for this Owner
Home Financials are based on the most recent Mortgage that was taken out on this home.
Original Mortgage
$53,900
Interest Rate
8.45%
Mortgage Type
New Conventional
Create a Home Valuation Report for This Property
The Home Valuation Report is an in-depth analysis detailing your home's value as well as a comparison with similar homes in the area
Home Values in the Area
Average Home Value in this Area
Purchase History
| Date | Buyer | Sale Price | Title Company |
|---|---|---|---|
| Muskie Holdings Llc | $2,887 | None Listed On Document | |
| Muskie Holdings Llc | $2,887 | None Listed On Document | |
| Delude Chris | -- | None Available | |
| Deutsche Bank National Trust | $60,800 | None Available | |
| Huckaby Billy J | -- | None Available | |
| Huckaby Billy | -- | -- |
Source: Public Records
Mortgage History
| Date | Status | Borrower | Loan Amount |
|---|---|---|---|
| Previous Owner | Huckaby Billy | $53,900 |
Source: Public Records
Tax History Compared to Growth
Tax History
| Year | Tax Paid | Tax Assessment Tax Assessment Total Assessment is a certain percentage of the fair market value that is determined by local assessors to be the total taxable value of land and additions on the property. | Land | Improvement |
|---|---|---|---|---|
| 2025 | $2,154 | $125,100 | $28,400 | $96,700 |
| 2024 | $2,154 | $109,500 | $24,600 | $84,900 |
| 2023 | $2,184 | $109,500 | $24,600 | $84,900 |
| 2022 | $2,168 | $92,700 | $21,400 | $71,300 |
| 2021 | $2,034 | $92,700 | $21,400 | $71,300 |
| 2020 | $2,112 | $81,500 | $18,700 | $62,800 |
| 2019 | $1,948 | $81,500 | $18,700 | $62,800 |
| 2018 | $1,928 | $72,500 | $16,200 | $56,300 |
| 2017 | $1,538 | $72,500 | $16,200 | $56,300 |
| 2016 | $1,494 | $65,400 | $14,600 | $50,800 |
| 2015 | $1,494 | $65,400 | $14,600 | $50,800 |
| 2014 | $1,534 | $68,800 | $14,900 | $53,900 |
Source: Public Records
Map
Nearby Homes