
Landlord's Agent in 2026
Ken Carn
Digital Realty
(630) 742-6789
7 in this area
173 Total Sales
Estimated Value: $313,000 - $334,000
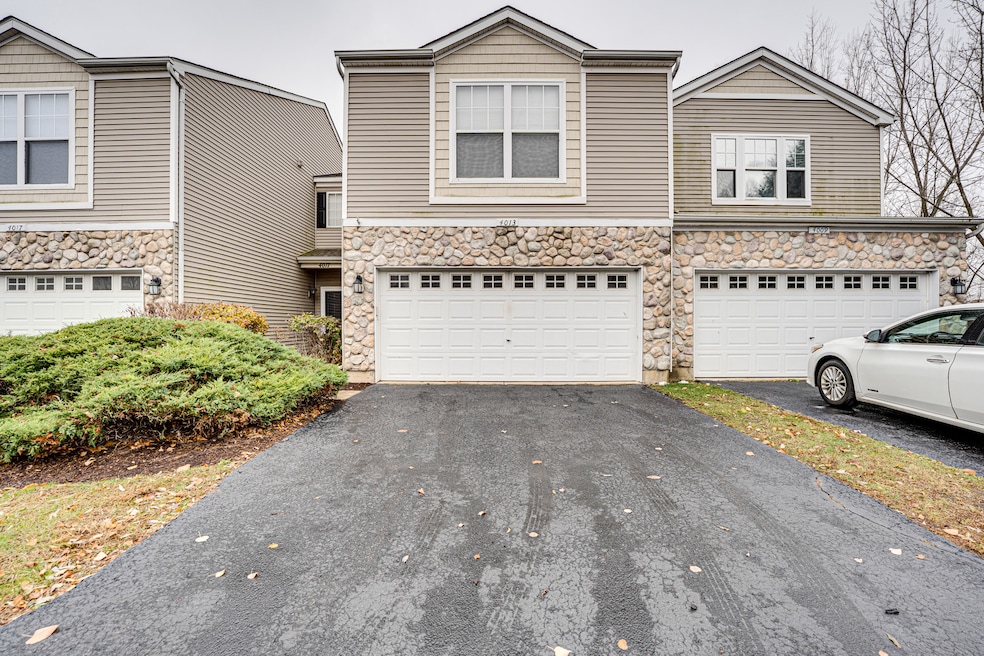
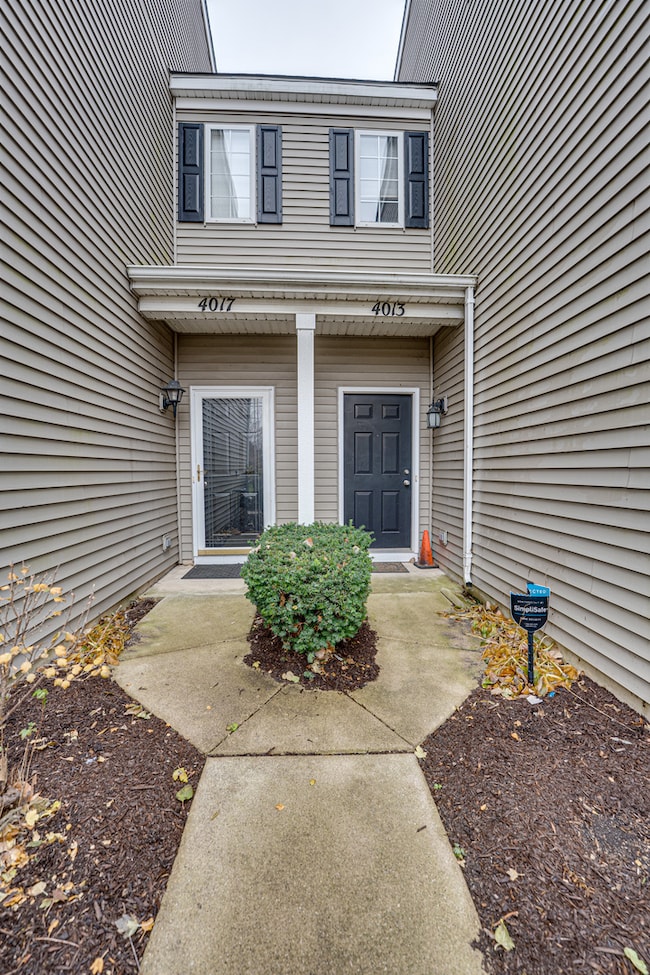
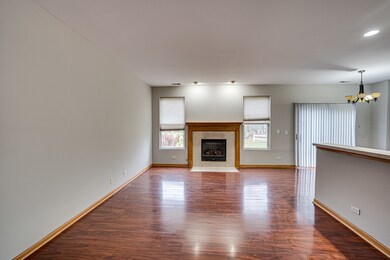
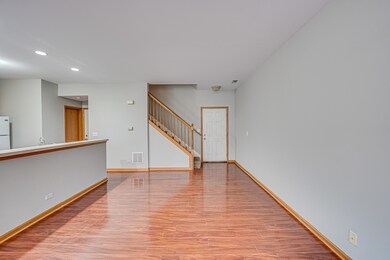
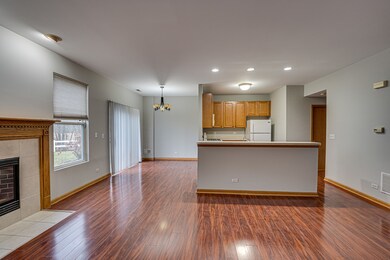
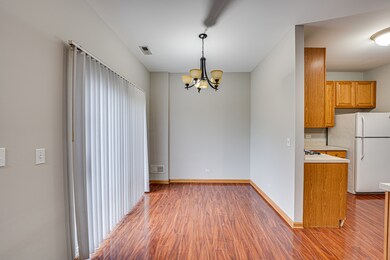
Blackstone's Finest, the Blue Sapphire Model! NAPERVILLE SCHOOL DISTRICT 204! Featuring Open Kitchen with 42 inch Oak Cabinets, Breakfast Bar, HW floors, Large Living Room with Gas Fireplace & Custom Oak Mantel, HUGE LOFT can be easily converted to 3rd bedroom & still leave space for loft making this a 3 bed plus loft! 2nd level laundry for Convenience! All appliances stay! Built in Cabinets in Garage, Levelor Soft Blinds Throughout, Large Common Area Behind Home / Concrete Patio, Keyless Entry! Bring All Offers!
| Date | Buyer | Sale Price | Title Company |
|---|---|---|---|
| Yallamraju Vikas | $156,000 | Attorneys Title Guaranty Fun | |
| Buchar William L | $182,000 | Multiple | |
| Falk Scott W | $180,500 | Ctic |
| Date | Status | Borrower | Loan Amount |
|---|---|---|---|
| Previous Owner | Buchar William L | $145,600 | |
| Previous Owner | Falk Scott W | $178,133 | |
| Closed | Buchar William L | $36,400 |
| Date | Event | Price | List to Sale | Price per Sq Ft | Prior Sale |
|---|---|---|---|---|---|
| 01/02/2026 01/02/26 | Rented | $2,300 | 0.0% | -- | |
| 12/08/2025 12/08/25 | Price Changed | $2,300 | -4.2% | $1 / Sq Ft | |
| 11/19/2025 11/19/25 | For Rent | $2,400 | +60.0% | -- | |
| 04/01/2018 04/01/18 | Rented | $1,500 | 0.0% | -- | |
| 02/19/2018 02/19/18 | Under Contract | -- | -- | -- | |
| 11/14/2017 11/14/17 | Price Changed | $1,500 | -3.2% | $1 / Sq Ft | |
| 10/03/2017 10/03/17 | For Rent | $1,550 | +6.9% | -- | |
| 10/01/2016 10/01/16 | Rented | $1,450 | 0.0% | -- | |
| 09/27/2016 09/27/16 | Under Contract | -- | -- | -- | |
| 08/30/2016 08/30/16 | Price Changed | $1,450 | 0.0% | $1 / Sq Ft | |
| 07/28/2016 07/28/16 | Sold | $156,000 | 0.0% | $100 / Sq Ft | View Prior Sale |
| 07/28/2016 07/28/16 | For Rent | $1,550 | 0.0% | -- | |
| 06/25/2016 06/25/16 | Pending | -- | -- | -- | |
| 06/15/2016 06/15/16 | Price Changed | $162,500 | -1.5% | $104 / Sq Ft | |
| 05/16/2016 05/16/16 | For Sale | $165,000 | -- | $106 / Sq Ft |
| Year | Tax Paid | Tax Assessment Tax Assessment Total Assessment is a certain percentage of the fair market value that is determined by local assessors to be the total taxable value of land and additions on the property. | Land | Improvement |
|---|---|---|---|---|
| 2024 | $6,526 | $85,826 | $19,364 | $66,462 |
| 2023 | $6,267 | $77,120 | $17,400 | $59,720 |
| 2022 | $5,758 | $68,660 | $15,360 | $53,300 |
| 2021 | $5,617 | $66,210 | $14,810 | $51,400 |
| 2020 | $5,685 | $66,210 | $14,810 | $51,400 |
| 2019 | $5,502 | $62,980 | $14,090 | $48,890 |
| 2018 | $4,827 | $54,650 | $12,400 | $42,250 |
| 2017 | $4,757 | $52,800 | $11,980 | $40,820 |
| 2016 | $4,130 | $50,670 | $11,500 | $39,170 |
| 2015 | $4,073 | $48,110 | $10,920 | $37,190 |
| 2014 | $4,290 | $49,060 | $10,950 | $38,110 |
| 2013 | $4,248 | $49,400 | $11,030 | $38,370 |
Landlord's Agent in 2026
Ken Carn
Digital Realty
(630) 742-6789
7 in this area
173 Total Sales
Tenant's Agent in 2026
Daniela Rosu
Xhomes Realty Inc
(253) 202-3380
2 in this area
26 Total Sales
Buyer's Agent in 2018
Carmen Poplawski
Century 21 Integra
(773) 805-0953
3 in this area
189 Total Sales
Seller's Agent in 2016
Ben Kastein
Advantage Realty Group
(630) 631-1296
3 in this area
143 Total Sales
Buyer's Agent in 2016
Paula Uber
Wheatland Realty
(630) 247-4337
30 Total Sales
Source: Midwest Real Estate Data (MRED)
MLS Number: 12520822
APN: 07-28-308-110
Disclaimer: Certain information contained herein is derived from information provided by parties other than Homes.com. All information provided is deemed reliable, but is not guaranteed to be accurate and should be independently verified.
![]() Based on information submitted to the MLS GRID. All data is obtained from various sources and may not have been verified by broker or MLS GRID. Supplied Open House Information is subject to change without notice. All information should be independently reviewed and verified for accuracy. Properties may or may not be listed by the office/agent presenting the information. Some IDX listings have been excluded from this website.
Based on information submitted to the MLS GRID. All data is obtained from various sources and may not have been verified by broker or MLS GRID. Supplied Open House Information is subject to change without notice. All information should be independently reviewed and verified for accuracy. Properties may or may not be listed by the office/agent presenting the information. Some IDX listings have been excluded from this website.
Based on information submitted to the MLS GRID
Ask me questions while you tour the home.