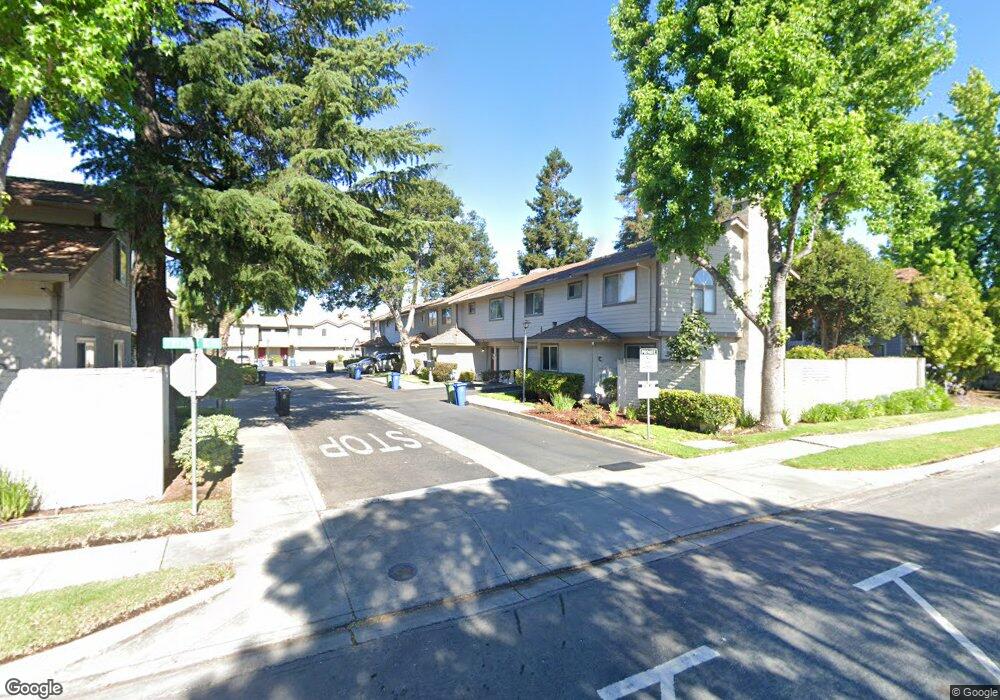
4013 Randy Common Fremont, CA 94538
Irvington NeighborhoodEstimated Value: $1,119,000 - $1,737,000
3
Beds
3
Baths
1,530
Sq Ft
$899/Sq Ft
Est. Value
About This Home
This home is located at 4013 Randy Common, Fremont, CA 94538 and is currently estimated at $1,375,855, approximately $899 per square foot. 4013 Randy Common is a home located in Alameda County with nearby schools including O. N. Hirsch Elementary School, John M. Horner Junior High School, and Irvington High School.
Ownership History
Date
Name
Owned For
Owner Type
Purchase Details
Closed on
Nov 13, 2017
Sold by
Ko Ryan and Ko Keng Tai
Bought by
Ko Ryan
Current Estimated Value
Home Financials for this Owner
Home Financials are based on the most recent Mortgage that was taken out on this home.
Original Mortgage
$355,000
Outstanding Balance
$297,473
Interest Rate
3.85%
Mortgage Type
Adjustable Rate Mortgage/ARM
Estimated Equity
$1,078,382
Purchase Details
Closed on
Nov 13, 2013
Sold by
Cruz Kathleen C and Straughan Kathleen C
Bought by
Ko Ryan and Ko Keng Tai
Home Financials for this Owner
Home Financials are based on the most recent Mortgage that was taken out on this home.
Original Mortgage
$385,000
Interest Rate
3.5%
Mortgage Type
Adjustable Rate Mortgage/ARM
Purchase Details
Closed on
Dec 2, 2002
Sold by
Cruz John Arthur
Bought by
Cruz Kathleen C and Straughan Kathleen C
Home Financials for this Owner
Home Financials are based on the most recent Mortgage that was taken out on this home.
Original Mortgage
$230,000
Interest Rate
5.5%
Purchase Details
Closed on
Apr 1, 1996
Sold by
Straughan Thomas M
Bought by
Straughan Kathleen C
Purchase Details
Closed on
Oct 12, 1994
Sold by
Straughan Kathleen
Bought by
Straughan Kathleen
Create a Home Valuation Report for This Property
The Home Valuation Report is an in-depth analysis detailing your home's value as well as a comparison with similar homes in the area
Home Values in the Area
Average Home Value in this Area
Purchase History
| Date | Buyer | Sale Price | Title Company |
|---|---|---|---|
| Ko Ryan | $238,000 | First American Title Company | |
| Ko Ryan | $550,000 | First American Title Company | |
| Cruz Kathleen C | -- | Chicago Title Company | |
| Straughan Kathleen C | -- | -- | |
| Straughan Kathleen | -- | -- | |
| Straughan Kathleen Clare | -- | -- |
Source: Public Records
Mortgage History
| Date | Status | Borrower | Loan Amount |
|---|---|---|---|
| Open | Ko Ryan | $355,000 | |
| Closed | Ko Ryan | $385,000 | |
| Previous Owner | Cruz Kathleen C | $230,000 |
Source: Public Records
Tax History Compared to Growth
Tax History
| Year | Tax Paid | Tax Assessment Tax Assessment Total Assessment is a certain percentage of the fair market value that is determined by local assessors to be the total taxable value of land and additions on the property. | Land | Improvement |
|---|---|---|---|---|
| 2025 | $8,241 | $674,194 | $202,258 | $471,936 |
| 2024 | $8,241 | $660,978 | $198,293 | $462,685 |
| 2023 | $8,020 | $648,020 | $194,406 | $453,614 |
| 2022 | $7,915 | $635,315 | $190,594 | $444,721 |
| 2021 | $7,728 | $622,863 | $186,859 | $436,004 |
| 2020 | $7,730 | $616,477 | $184,943 | $431,534 |
| 2019 | $7,643 | $604,394 | $181,318 | $423,076 |
| 2018 | $9,114 | $730,855 | $219,256 | $511,599 |
| 2017 | $7,309 | $580,931 | $174,279 | $406,652 |
| 2016 | $7,183 | $569,541 | $170,862 | $398,679 |
| 2015 | $7,084 | $560,988 | $168,296 | $392,692 |
| 2014 | $6,970 | $550,000 | $165,000 | $385,000 |
Source: Public Records
Map
Nearby Homes
- 3923 Wildflower Common Unit 19
- 3872 Wildflower Common Unit 27
- 3918 Fossano Common
- 41882 Gifford St
- 3800 Adams Ave
- 41212 Fremont Blvd
- 4309 Bora Ave
- 42759 Newport Dr
- 42747 Wixon Dr
- 4533 Capewood Terrace
- 4537 Capewood Terrace
- 4463 Hyde Common Unit 306
- 42932 Peachwood St
- 4310 Providence Terrace
- 4214 Providence Terrace
- 40696 Robin St
- 40708 Fremont Blvd
- 40769 Squill Common
- 40702 Greystone Terrace Unit 9
- 3331 Union St
- 4021 Randy Common
- 4019 Randy Common
- 4007 Randy Common
- 4030 Allyson Terrace Unit 3
- 4042 Allyson Terrace
- 4001 Randy Common
- 4018 Allyson Terrace
- 4054 Allyson Terrace Unit 5
- 4055 Randy Common
- 4049 Randy Common
- 4006 Allyson Terrace Unit 1
- 4061 Randy Common
- 4025 Randy Common
- 4031 Randy Common
- 4037 Randy Common
- 41563 Patton Terrace
- 4043 Randy Common
- 41561 Patton Terrace Unit 7
- 4039 Stanley Ave
- 4009 Stanley Ave