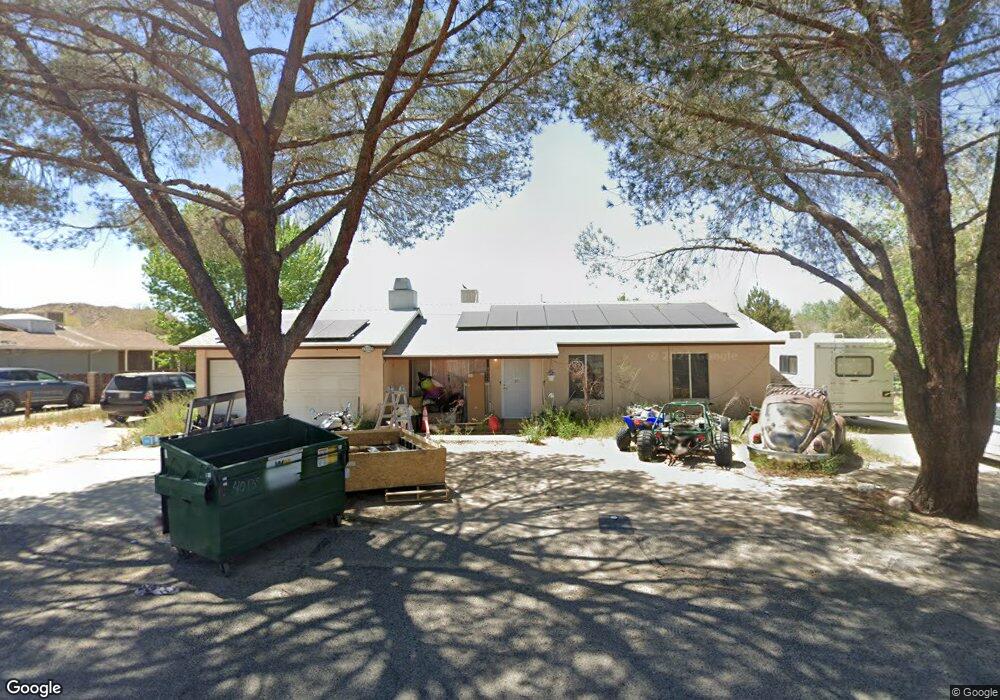
40135 178th St E Palmdale, CA 93591
Estimated Value: $271,000 - $374,000
4
Beds
2
Baths
1,248
Sq Ft
$255/Sq Ft
Est. Value
About This Home
This home is located at 40135 178th St E, Palmdale, CA 93591 and is currently estimated at $318,217, approximately $254 per square foot. 40135 178th St E is a home located in Los Angeles County with nearby schools including Vista San Gabriel Elementary School, Challenger Middle School, and Littlerock High School.
Ownership History
Date
Name
Owned For
Owner Type
Purchase Details
Closed on
Jul 13, 2011
Sold by
Federal National Mortgage Association
Bought by
Hennion Steven R and Hennion Kimberly R
Current Estimated Value
Purchase Details
Closed on
Mar 31, 2011
Sold by
Hallack Barbara Lynn
Bought by
Federal National Mortgage Association
Purchase Details
Closed on
Aug 23, 2003
Sold by
Hallack B L
Bought by
Hallack Barbara Lynn and The Trust Of Barbara Lynn Hallack
Purchase Details
Closed on
Oct 16, 2000
Sold by
Forbes Haddy G
Bought by
Hallack B L
Home Financials for this Owner
Home Financials are based on the most recent Mortgage that was taken out on this home.
Original Mortgage
$6,000
Interest Rate
7.9%
Mortgage Type
Purchase Money Mortgage
Purchase Details
Closed on
Aug 26, 1997
Sold by
Va
Bought by
Forbes Haddy G
Create a Home Valuation Report for This Property
The Home Valuation Report is an in-depth analysis detailing your home's value as well as a comparison with similar homes in the area
Home Values in the Area
Average Home Value in this Area
Purchase History
| Date | Buyer | Sale Price | Title Company |
|---|---|---|---|
| Hennion Steven R | $37,000 | Lsi Title Company | |
| Federal National Mortgage Association | $206,625 | None Available | |
| Hallack Barbara Lynn | -- | -- | |
| Hallack B L | $55,500 | Fidelity National Title Co | |
| Forbes Heady G | -- | Fidelity National Title Co | |
| Forbes Haddy G | -- | -- |
Source: Public Records
Mortgage History
| Date | Status | Borrower | Loan Amount |
|---|---|---|---|
| Previous Owner | Forbes Heady G | $6,000 | |
| Previous Owner | Hallack B L | $32,000 | |
| Closed | Hallack B L | $18,000 |
Source: Public Records
Tax History
| Year | Tax Paid | Tax Assessment Tax Assessment Total Assessment is a certain percentage of the fair market value that is determined by local assessors to be the total taxable value of land and additions on the property. | Land | Improvement |
|---|---|---|---|---|
| 2025 | $806 | $46,460 | $29,259 | $17,201 |
| 2024 | $806 | $45,550 | $28,686 | $16,864 |
| 2023 | $796 | $44,658 | $28,124 | $16,534 |
| 2022 | $784 | $43,783 | $27,573 | $16,210 |
| 2021 | $763 | $42,926 | $27,033 | $15,893 |
| 2019 | $739 | $41,655 | $26,232 | $15,423 |
| 2018 | $726 | $40,839 | $25,718 | $15,121 |
| 2016 | $676 | $39,255 | $24,720 | $14,535 |
| 2015 | $667 | $38,666 | $24,349 | $14,317 |
| 2014 | $680 | $37,910 | $23,873 | $14,037 |
Source: Public Records
Map
Nearby Homes
- 40166 178th St E
- 0 Highacres Ave Unit 202505034
- 40226 177th St E
- 40140 Ridgemist St
- 0 Vic Ridgemist St & Highacres A
- 40315 177th St E
- 40054 Ridgemist St
- 40020 176th St E
- 0 179th St E Unit SR25187149
- 0 Vac Cor Avenue U Vic 263 Ste Unit SR23009857
- 132 E Vic Avenue N9
- 0 E Avenue N-8 Unit PW25156695
- 0 Avenue P-12 Unit 25006957
- 190 E Palmdale Blvd
- 4 Longview Rd
- 0 Vac Vic Avenue U Unit SR25271578
- 0 E Ave N-12 Unit 25007803
- 137 E Avenue N6
- 0 Vac Vic Avenue #6 149 Unit HD25214834
- 0 E Ave P4 Vic 230 St Unit IV26012999
- 40145 178th St E
- 40125 178th St E
- 40132 178th St E
- 40144 178th St E
- 40124 178th St E
- 40155 178th St E
- 40113 178th St E
- 40154 178th St E
- 40112 178th St E
- 40165 178th St E
- 40146 177th St E
- 40103 178th St E
- 40124 177th St E
- 40104 178th St E
- 40156 177th St E
- 40116 177th St E
- 40134 177th St E
- 40175 178th St E
- 40141 179th St E Unit E
- 40141 179th St E
Your Personal Tour Guide
Ask me questions while you tour the home.