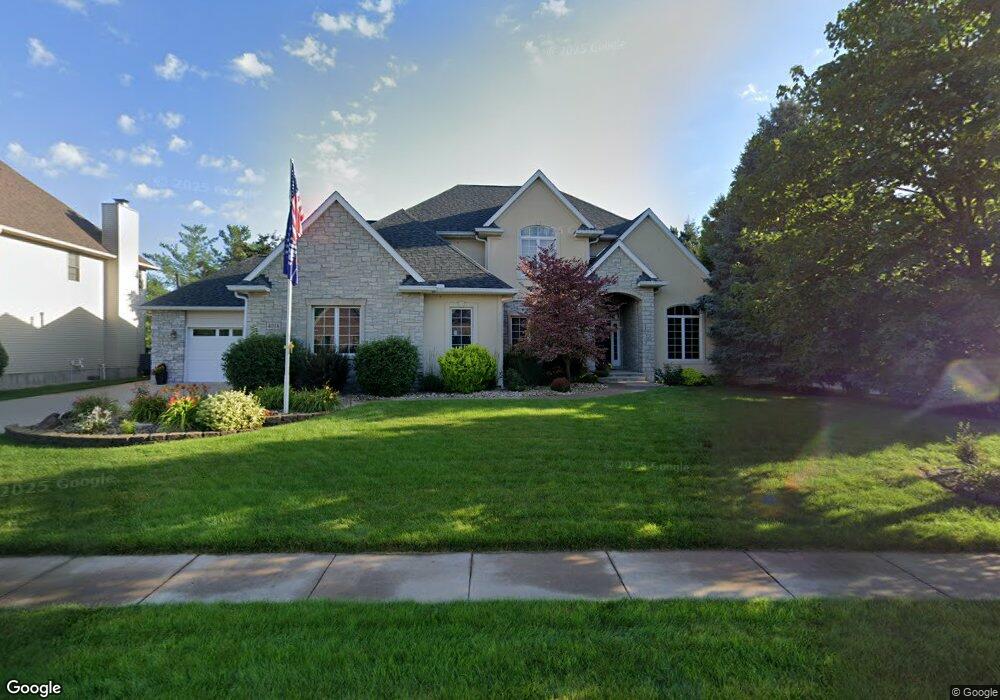
4014 Kathleen Way Davenport, IA 52807
Estimated Value: $654,000 - $742,003
4
Beds
4
Baths
2,921
Sq Ft
$242/Sq Ft
Est. Value
About This Home
This home is located at 4014 Kathleen Way, Davenport, IA 52807 and is currently estimated at $708,001, approximately $242 per square foot. 4014 Kathleen Way is a home located in Scott County with nearby schools including Grant Wood Elementary School, Bettendorf Middle School, and Bettendorf High School.
Ownership History
Date
Name
Owned For
Owner Type
Purchase Details
Closed on
May 1, 2020
Sold by
Yeggy Benjamin A
Bought by
Ramstack Thomas F and Harsh Aluri
Current Estimated Value
Home Financials for this Owner
Home Financials are based on the most recent Mortgage that was taken out on this home.
Original Mortgage
$510,400
Outstanding Balance
$453,971
Interest Rate
3.5%
Mortgage Type
New Conventional
Estimated Equity
$254,030
Purchase Details
Closed on
Apr 13, 2016
Sold by
Woods Construction And Development Inc
Bought by
Medina Bryan M and Medina Julie K Hahn
Purchase Details
Closed on
Sep 25, 2015
Sold by
Ramstack Thomas Francis and Harsh Lauri Ann
Bought by
Ramstack Thomas F and Thomas F Ramstack Revocable Trust
Purchase Details
Closed on
Mar 10, 2015
Sold by
Ramstack Thomas F and Harsh Lauri A
Bought by
Harsh Lauri A and Lauri A Harsh Revocable Trust
Create a Home Valuation Report for This Property
The Home Valuation Report is an in-depth analysis detailing your home's value as well as a comparison with similar homes in the area
Home Values in the Area
Average Home Value in this Area
Purchase History
| Date | Buyer | Sale Price | Title Company |
|---|---|---|---|
| Ramstack Thomas F | -- | None Available | |
| Medina Bryan M | $594,500 | None Available | |
| Ramstack Thomas F | -- | Attorney | |
| Ramstack Thomas Francis | -- | Attorney | |
| Harsh Lauri A | -- | None Available |
Source: Public Records
Mortgage History
| Date | Status | Borrower | Loan Amount |
|---|---|---|---|
| Open | Ramstack Thomas F | $510,400 |
Source: Public Records
Tax History Compared to Growth
Tax History
| Year | Tax Paid | Tax Assessment Tax Assessment Total Assessment is a certain percentage of the fair market value that is determined by local assessors to be the total taxable value of land and additions on the property. | Land | Improvement |
|---|---|---|---|---|
| 2024 | $11,042 | $658,540 | $69,380 | $589,160 |
| 2023 | $12,058 | $658,540 | $69,380 | $589,160 |
| 2022 | $11,650 | $613,960 | $69,380 | $544,580 |
| 2021 | $11,650 | $599,830 | $69,380 | $530,450 |
| 2020 | $12,024 | $598,490 | $69,380 | $529,110 |
| 2019 | $13,406 | $641,280 | $69,380 | $571,900 |
| 2018 | $13,270 | $641,280 | $69,380 | $571,900 |
| 2017 | $3,541 | $636,670 | $69,380 | $567,290 |
| 2016 | $13,220 | $636,670 | $0 | $0 |
| 2015 | $13,220 | $627,640 | $0 | $0 |
| 2014 | $13,172 | $627,640 | $0 | $0 |
| 2013 | $12,892 | $0 | $0 | $0 |
| 2012 | -- | $618,820 | $84,690 | $534,130 |
Source: Public Records
Map
Nearby Homes
- 4006 Kathleen Way
- 6401 Utica Ridge Rd Unit 4
- 9 E 61st Ct
- 1908 Katie Ct
- 1708 E 59th Ct
- 1816 E 59th Ct
- 1810 E 59th Ct
- 1804 E 59th Ct
- 1714 E 59th Ct
- 1705 E 59th Ct
- 1711 E 59th Ct
- 1717 E 59th Ct
- 1807 E 59th Ct
- 1813 E 59th Ct
- 1814 Katie Ct
- 4150 E 60th St Unit 1004
- 1918 E 59th Ct
- 1912 E 59th Ct
- 1906 E 59th Ct
- 1716 Katie Ct
- 4010 Kathleen Way
- 4018 Kathleen Way
- 4022 Kathleen Way
- 4021 Thomas Pointe Rd
- 4025 Thomas Pointe Rd
- 4011 Kathleen Way
- 4017 Thomas Pointe Rd
- 4015 Kathleen Way
- 4029 Thomas Pointe Rd
- 4007 Kathleen Way
- 4002 Kathleen Way
- 4017 Kathleen Way
- 4013 Thomas Pointe Rd
- 6403 Patrick Pointe Rd
- 4003 Kathleen Way
- 4024 Thomas Pointe Rd
- 4021 Kathleen Way
- 4004 Lakehurst Ct
- 4020 Thomas Pointe Rd
- 4009 Thomas Pointe Rd