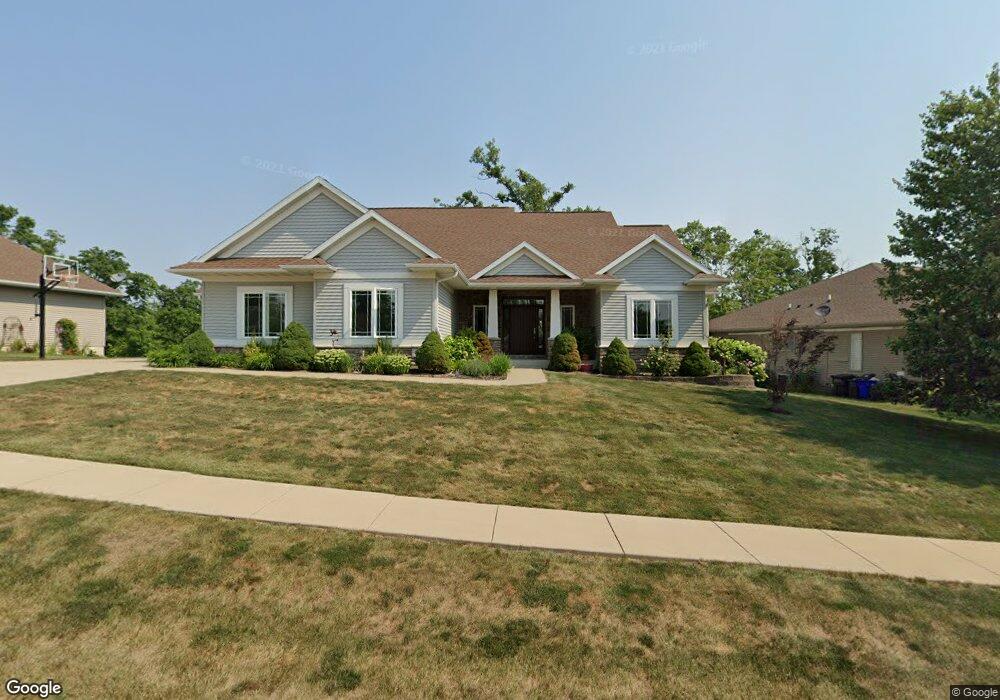
4014 Windfall Dr NW Cedar Rapids, IA 52405
Estimated Value: $417,000 - $482,000
5
Beds
5
Baths
1,740
Sq Ft
$258/Sq Ft
Est. Value
About This Home
This home is located at 4014 Windfall Dr NW, Cedar Rapids, IA 52405 and is currently estimated at $448,832, approximately $257 per square foot. 4014 Windfall Dr NW is a home located in Linn County with nearby schools including Maple Grove Elementary School, Taft Middle School, and John F. Kennedy High School.
Ownership History
Date
Name
Owned For
Owner Type
Purchase Details
Closed on
Aug 2, 2011
Sold by
Fandel Mathew and Fandel Ashlee
Bought by
Hilgenberg Craig J and Wiegand Monica A
Current Estimated Value
Home Financials for this Owner
Home Financials are based on the most recent Mortgage that was taken out on this home.
Original Mortgage
$232,800
Outstanding Balance
$156,840
Interest Rate
4%
Mortgage Type
Adjustable Rate Mortgage/ARM
Estimated Equity
$291,992
Purchase Details
Closed on
Sep 15, 2006
Sold by
Wilmar Development Co
Bought by
Fandel Mathew and Fandel Ashlee
Home Financials for this Owner
Home Financials are based on the most recent Mortgage that was taken out on this home.
Original Mortgage
$53,500
Interest Rate
8%
Mortgage Type
Balloon
Create a Home Valuation Report for This Property
The Home Valuation Report is an in-depth analysis detailing your home's value as well as a comparison with similar homes in the area
Purchase History
| Date | Buyer | Sale Price | Title Company |
|---|---|---|---|
| Hilgenberg Craig J | $290,500 | None Available | |
| Fandel Mathew | $58,000 | None Available |
Source: Public Records
Mortgage History
| Date | Status | Borrower | Loan Amount |
|---|---|---|---|
| Open | Hilgenberg Craig J | $232,800 | |
| Previous Owner | Fandel Mathew | $53,500 |
Source: Public Records
Tax History
| Year | Tax Paid | Tax Assessment Tax Assessment Total Assessment is a certain percentage of the fair market value that is determined by local assessors to be the total taxable value of land and additions on the property. | Land | Improvement |
|---|---|---|---|---|
| 2025 | $6,770 | $419,500 | $99,300 | $320,200 |
| 2024 | $6,958 | $413,200 | $99,300 | $313,900 |
| 2023 | $6,958 | $393,000 | $86,200 | $306,800 |
| 2022 | $6,560 | $338,800 | $86,200 | $252,600 |
| 2021 | $7,026 | $325,600 | $75,800 | $249,800 |
| 2020 | $7,026 | $327,000 | $75,800 | $251,200 |
| 2019 | $6,192 | $295,800 | $41,800 | $254,000 |
Source: Public Records
Map
Nearby Homes
- 3802 Richland Dr NW
- 1608 Morris Ave NW
- 327* Edgewood Rd NW
- 1632 Elaine Dr NW
- 1719 Southview Dr NW
- 1722 Gardner Dr NW
- 1630 Woodside Ct NW
- 1721 Woodside Ct NW
- 4341 Beecher Ct NW
- S River Bluffs Dr Unit S of River Bluffs Dr
- 1536 Woodside Dr NW
- 0 River Bluffs Dr
- 1209 39th Street Rd NW
- 1211 Wolf Dr NW
- 2908 Schultz Dr NW
- 5225 Seminole Valley Trail NE
- 2601 Zika Ave NW
- See Remarks Seminole Valley Trail NE
- 5801 Seminole Valley Trail NE
- 5413 Seminole Valley Trail NE
- 4010 Windfall Dr NW
- 4026 Windfall Dr NW
- 4008 Windfall Dr NW Unit 2
- 3932 Windfall Dr NW
- 4032 Windfall Dr NW
- 4009 Windfall Dr NW
- 4015 Windfall Dr NW
- 4029 Windfall Dr NW
- 4003 Windfall Dr NW
- 3926 Windfall Dr NW
- 4100 Windfall Dr NW
- 1915 Grannie Smith Ln NW
- 1926 Pippin Hill Ct NW
- 3920 Windfall Dr NW
- 1909 Grannie Smith Ln NW
- 4120 Windfall Dr NW
- 3914 Windfall Dr NW
- 1903 Grannie Smith Ln NW
- 4127 Windfall Dr NW
- 4126 Windfall Dr NW
Your Personal Tour Guide
Ask me questions while you tour the home.