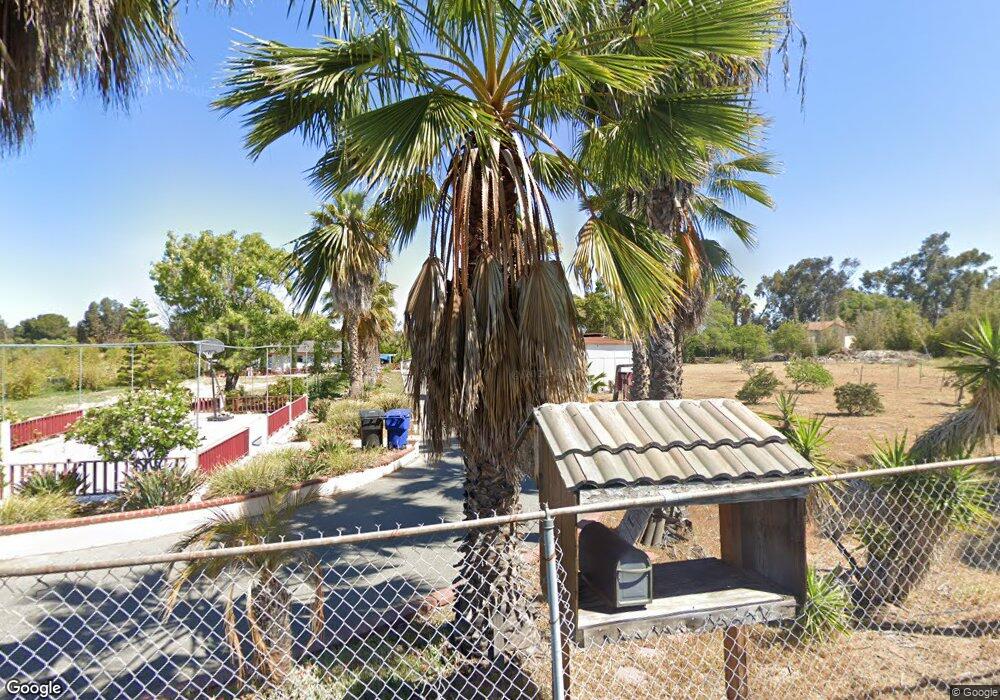
4015 Allen School Rd Bonita, CA 91902
Bonita South NeighborhoodEstimated Value: $1,470,000 - $1,643,229
5
Beds
5
Baths
3,580
Sq Ft
$435/Sq Ft
Est. Value
About This Home
This home is located at 4015 Allen School Rd, Bonita, CA 91902 and is currently estimated at $1,558,557, approximately $435 per square foot. 4015 Allen School Rd is a home located in San Diego County with nearby schools including Ella B. Allen Elementary School, Bonita Vista Middle School, and Bonita Vista Senior High School.
Ownership History
Date
Name
Owned For
Owner Type
Purchase Details
Closed on
Oct 2, 2014
Sold by
Wang Chao Chin and Wang Chin Hsiu Kathy C
Bought by
Mytek International Inc
Current Estimated Value
Purchase Details
Closed on
Aug 5, 2008
Sold by
Wang Chao Chin and Wang Chin Hsiu Kathy C
Bought by
Wang Chao Chin and Wang Chin Hsiu Kathy C
Purchase Details
Closed on
Jan 3, 2002
Sold by
Roll William Henry Lang and Roll Ralph Edward Lang
Bought by
Wang Chao Chin and Wang Chin Hsiu Kathy C
Home Financials for this Owner
Home Financials are based on the most recent Mortgage that was taken out on this home.
Original Mortgage
$700,000
Interest Rate
6.43%
Mortgage Type
Unknown
Purchase Details
Closed on
Apr 22, 2000
Sold by
Roll William H L and Roll Susan A
Bought by
Roll William H L and Roll Susan M
Purchase Details
Closed on
Aug 14, 1992
Create a Home Valuation Report for This Property
The Home Valuation Report is an in-depth analysis detailing your home's value as well as a comparison with similar homes in the area
Home Values in the Area
Average Home Value in this Area
Purchase History
| Date | Buyer | Sale Price | Title Company |
|---|---|---|---|
| Mytek International Inc | -- | Orange Coast Title | |
| Wang Chao Chin | -- | None Available | |
| Wang Chao Chin | $1,000,000 | Old Republic Title Company | |
| Roll William H L | -- | -- | |
| -- | $535,000 | -- |
Source: Public Records
Mortgage History
| Date | Status | Borrower | Loan Amount |
|---|---|---|---|
| Previous Owner | Wang Chao Chin | $700,000 |
Source: Public Records
Tax History Compared to Growth
Tax History
| Year | Tax Paid | Tax Assessment Tax Assessment Total Assessment is a certain percentage of the fair market value that is determined by local assessors to be the total taxable value of land and additions on the property. | Land | Improvement |
|---|---|---|---|---|
| 2025 | $8,581 | $738,846 | $369,423 | $369,423 |
| 2024 | $8,581 | $724,360 | $362,180 | $362,180 |
| 2023 | $8,462 | $710,158 | $355,079 | $355,079 |
| 2022 | $8,219 | $696,234 | $348,117 | $348,117 |
| 2021 | $8,029 | $682,584 | $341,292 | $341,292 |
| 2020 | $7,837 | $675,586 | $337,793 | $337,793 |
| 2019 | $7,634 | $662,340 | $331,170 | $331,170 |
| 2018 | $7,516 | $649,354 | $324,677 | $324,677 |
| 2017 | $7,358 | $636,622 | $318,311 | $318,311 |
| 2016 | $7,186 | $624,140 | $312,070 | $312,070 |
| 2015 | $7,083 | $614,766 | $307,383 | $307,383 |
| 2014 | $6,965 | $602,724 | $301,362 | $301,362 |
Source: Public Records
Map
Nearby Homes
- 4521 Villas Dr
- 4621 Villas Ct
- 4614 Villas Dr
- 4600 Villas Dr
- 4631 Villas Ct
- 4095 Bonita Rd Unit 128
- 4095 Bonita Rd Unit 229
- 4095 Bonita Rd Unit 109
- 363 Surrey Dr
- 0 Otay Lakes Rd Unit PTP2505558
- 3928 La Cresta Way
- 3714 Bonita Glen Terrace
- 987 Palencia Ct
- 743 Terra Nova Dr
- 6795 Parkside Ave
- 6767 Parkside Ave
- 6771 Parkside Ave
- 6759 Parkside Ave
- 3750 Valley Vista Fork
- 5208 Glen Verde Dr
- 4348 Loma Paseo
- 4368 Bonita Rd
- 4354 Loma Paseo
- 4003 Allen School Rd
- 3955 Allen School Rd
- 3926 Otay Lakes Rd
- 4349 Loma Paseo
- 4019 Allen School Rd
- 3948 Otay Lakes Rd
- 4021 Allen School Rd
- 4366 Bonita Rd
- 3930 Allen School Rd
- 166 Otay Lakes Rd
- 3845 Allen School Rd
- 3954 Allen School Rd
- 4410 Bonita Rd
- 4429 Loma Paseo
- 4397 Allen School Ln
- 4446 Bonita Rd
- 4414 Bonita Rd