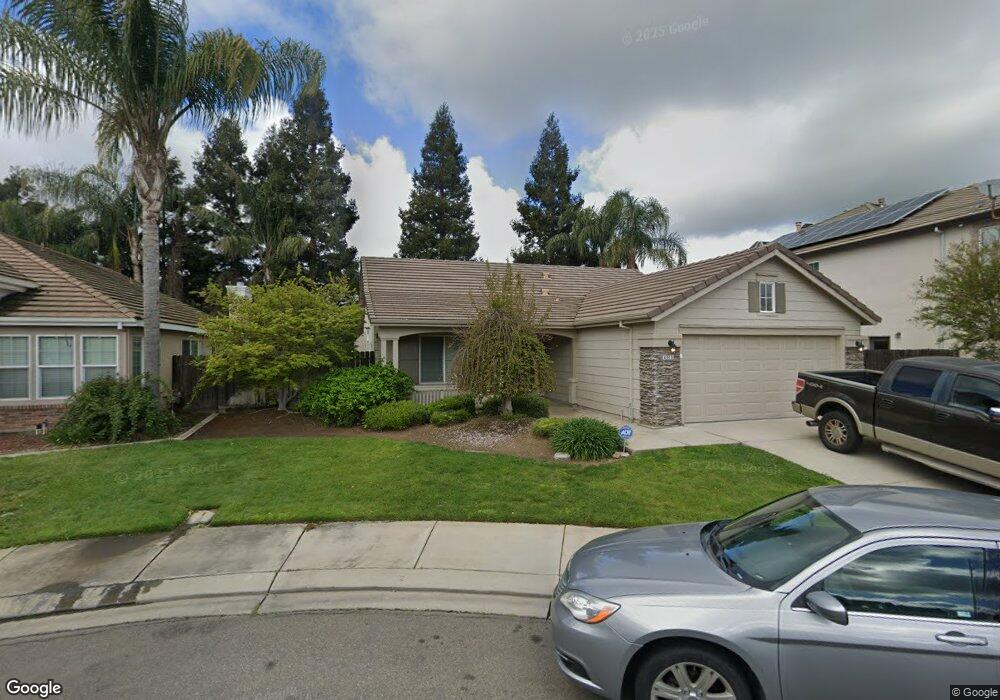
4015 Casual Ct Merced, CA 95340
Estimated Value: $376,000 - $441,000
3
Beds
4
Baths
1,434
Sq Ft
$288/Sq Ft
Est. Value
About This Home
This home is located at 4015 Casual Ct, Merced, CA 95340 and is currently estimated at $412,348, approximately $287 per square foot. 4015 Casual Ct is a home located in Merced County with nearby schools including Allan Peterson Elementary School, Herbert H. Cruickshank Middle School, and El Capitan High School.
Ownership History
Date
Name
Owned For
Owner Type
Purchase Details
Closed on
Dec 28, 2020
Sold by
Beach Gene A and Beach Patricia K
Bought by
Beach Gene and Beach Patricia K
Current Estimated Value
Home Financials for this Owner
Home Financials are based on the most recent Mortgage that was taken out on this home.
Original Mortgage
$205,000
Outstanding Balance
$182,931
Interest Rate
2.7%
Mortgage Type
New Conventional
Estimated Equity
$229,417
Purchase Details
Closed on
Feb 19, 2010
Sold by
Riley Diana E
Bought by
Rodrigues Donna M and Donna M Rodrigues Trust
Purchase Details
Closed on
Feb 27, 2003
Sold by
Heritage Homes Llc
Bought by
Riley Diana E
Home Financials for this Owner
Home Financials are based on the most recent Mortgage that was taken out on this home.
Original Mortgage
$164,736
Interest Rate
5.13%
Mortgage Type
Purchase Money Mortgage
Create a Home Valuation Report for This Property
The Home Valuation Report is an in-depth analysis detailing your home's value as well as a comparison with similar homes in the area
Purchase History
We collect this data history from publicly available records. To have your information removed, we recommend requesting removal directly through your county’s website.
| Date | Buyer | Sale Price | Title Company |
|---|---|---|---|
| Beach Gene | -- | North American Title Co Inc | |
| Beach Gene | -- | North American Title Co Inc | |
| Rodrigues Donna M | $165,000 | Transcounty Title Company | |
| Riley Diana E | $206,000 | Transcounty Title Company |
Source: Public Records
Mortgage History
We collect this data history from publicly available records. To have your information removed, we recommend requesting removal directly through your county’s website.
| Date | Status | Borrower | Loan Amount |
|---|---|---|---|
| Open | Beach Gene | $205,000 | |
| Previous Owner | Riley Diana E | $164,736 |
Source: Public Records
Tax History
| Year | Tax Paid | Tax Assessment Tax Assessment Total Assessment is a certain percentage of the fair market value that is determined by local assessors to be the total taxable value of land and additions on the property. | Land | Improvement |
|---|---|---|---|---|
| 2025 | $3,075 | $266,927 | $52,222 | $214,705 |
| 2024 | $3,075 | $261,695 | $51,199 | $210,496 |
| 2023 | $3,054 | $256,565 | $50,196 | $206,369 |
| 2022 | $3,011 | $251,535 | $49,212 | $202,323 |
| 2021 | $3,024 | $246,604 | $48,248 | $198,356 |
| 2020 | $2,950 | $244,077 | $47,754 | $196,323 |
| 2019 | $2,922 | $239,292 | $46,818 | $192,474 |
| 2018 | $2,681 | $234,600 | $45,900 | $188,700 |
| 2017 | $2,754 | $230,000 | $45,000 | $185,000 |
| 2016 | $2,212 | $179,912 | $11,992 | $167,920 |
| 2015 | $2,164 | $177,210 | $11,812 | $165,398 |
| 2014 | $2,116 | $173,740 | $11,581 | $162,159 |
Source: Public Records
Map
Nearby Homes
- 1427 Caraway Ct
- 0 Dunn Rd Unit MC25278439
- 0 Dunn Rd Unit MC25278437
- 3856 N Gardner Ave
- 1862 Dunn Rd
- 3882 Pintail Ct
- 3947 Finch Ct
- 724 Robin Dr
- 785 Kinglet Ct
- 591 Bobolink Ct Unit 2
- 3546 Joerg Ave
- 1165 Inspiration Point Ct
- 945 Gazelle Ct
- 3969 Hatch Rd
- 692 Gateway Cir
- 2182 Spanish Bay Ct
- 1986 Woodhaven Ct
- 1833 La Quinta Ct
- 3583 Vernal Ave
- 1048 Vernal Ave
- 4021 Casual Ct
- 4003 Casual Ct
- 4012 Strolling Ct
- 4029 Casual Ct
- 4018 Strolling Ct
- 4008 Strolling Ct
- 4024 Strolling Ct
- 4037 Casual Ct
- 4014 Casual Ct
- 4026 Casual Ct
- 4006 Casual Ct
- 4032 Casual Ct
- 4032 Strolling Ct
- 4043 Casual Ct
- 4038 Casual Ct
- 4048 Strolling Ct
- 1405 Davenport Dr
- 4007 Strolling Ct
- 4013 Strolling Ct
- 4046 Casual Ct
Your Personal Tour Guide
Ask me questions while you tour the home.