4015 Glass Rd NE Cedar Rapids, IA 52402
Estimated Value: $752,092
--
Bed
--
Bath
4,632
Sq Ft
$162/Sq Ft
Est. Value
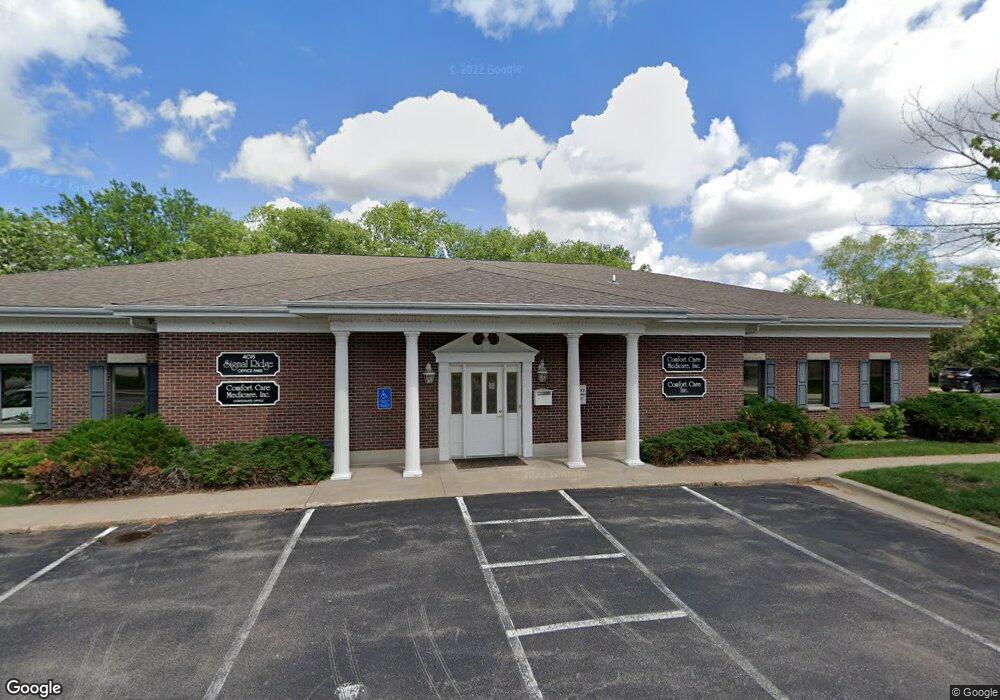
About This Home
This home is located at 4015 Glass Rd NE, Cedar Rapids, IA 52402 and is currently estimated at $752,092, approximately $162 per square foot. 4015 Glass Rd NE is a home located in Linn County with nearby schools including Ponderosa Elementary School, Pierce Elementary School, and Franklin Middle School.
Ownership History
Date
Name
Owned For
Owner Type
Purchase Details
Closed on
Aug 28, 2019
Sold by
Tow Llc
Bought by
Hawkzilla Investments Llc
Current Estimated Value
Home Financials for this Owner
Home Financials are based on the most recent Mortgage that was taken out on this home.
Original Mortgage
$450,672
Outstanding Balance
$66,550
Interest Rate
3.7%
Mortgage Type
Future Advance Clause Open End Mortgage
Estimated Equity
$685,542
Purchase Details
Closed on
May 14, 2014
Sold by
Lenane Kevin and Lenane Karen
Bought by
Tow Llc
Home Financials for this Owner
Home Financials are based on the most recent Mortgage that was taken out on this home.
Original Mortgage
$450,000
Interest Rate
4.34%
Mortgage Type
Future Advance Clause Open End Mortgage
Purchase Details
Closed on
Oct 31, 2005
Sold by
Fletcher Leasing Co
Bought by
Lenane Kevin and Lenane Karen
Purchase Details
Closed on
Jan 16, 1998
Sold by
Signal Ridge Development Company Ii
Bought by
Fletcher Leasing Co
Create a Home Valuation Report for This Property
The Home Valuation Report is an in-depth analysis detailing your home's value as well as a comparison with similar homes in the area
Home Values in the Area
Average Home Value in this Area
Purchase History
| Date | Buyer | Sale Price | Title Company |
|---|---|---|---|
| Hawkzilla Investments Llc | $565,000 | None Available | |
| Tow Llc | $450,000 | None Available | |
| Lenane Kevin | $529,500 | -- | |
| Fletcher Leasing Co | $61,500 | -- |
Source: Public Records
Mortgage History
| Date | Status | Borrower | Loan Amount |
|---|---|---|---|
| Open | Hawkzilla Investments Llc | $450,672 | |
| Previous Owner | Tow Llc | $450,000 |
Source: Public Records
Tax History Compared to Growth
Tax History
| Year | Tax Paid | Tax Assessment Tax Assessment Total Assessment is a certain percentage of the fair market value that is determined by local assessors to be the total taxable value of land and additions on the property. | Land | Improvement |
|---|---|---|---|---|
| 2025 | $14,378 | $519,200 | $130,700 | $388,500 |
| 2024 | $17,804 | $491,100 | $130,700 | $360,400 |
| 2023 | $17,804 | $491,100 | $130,700 | $360,400 |
| 2022 | $16,842 | $571,500 | $130,700 | $440,800 |
| 2021 | $16,962 | $1,012,300 | $130,700 | $881,600 |
| 2020 | $16,962 | $1,008,100 | $130,700 | $877,400 |
| 2019 | $17,798 | $569,400 | $130,700 | $438,700 |
| 2018 | $17,714 | $569,400 | $130,700 | $438,700 |
| 2017 | $15,636 | $504,300 | $130,700 | $373,600 |
| 2016 | $17,343 | $504,300 | $130,700 | $373,600 |
| 2015 | $16,734 | $487,026 | $130,680 | $356,346 |
| 2014 | $16,734 | $487,026 | $130,680 | $356,346 |
| 2013 | $16,786 | $487,026 | $130,680 | $356,346 |
Source: Public Records
Map
Nearby Homes
- 4010 Red Cedar Dr NE Unit B
- 3920 Wyndham Dr NE
- 3915 Lexington Dr NE Unit B
- 4113 Lexington Ct NE Unit C
- 4113 Lexington Ct NE Unit A
- 3607 Foxborough Terrace NE Unit A
- 3608 Foxborough Terrace NE Unit B
- 3524 Swallow Ct NE
- 4131 Blue Jay Dr NE Unit A
- 4131 Blue Jay Dr NE Unit C
- 2817 Old Orchard Rd NE
- 4113 Lark Ct NE Unit 4113
- 5230 Edgewood Rd NE
- 122 Lakota Ct NE
- 4417 Twin Pine Dr NE
- 4104 Treeline Ct NE Unit 4104
- 3604 Heatheridge Dr NE
- 4433 Coventry Ln NE
- 4105 N Willowbend Rd NE
- 2611 Brookland Dr NE
- 4015 Glass Rd NE Unit 201
- 4015 Glass Rd NE Unit 301
- 3919 Belden Ct NE
- 4101 Glass Rd NE
- 4005 Glass Rd NE Unit 301
- 4005 Glass Rd NE
- 3909 Belden Ct NE
- 3905 Belden Ct NE
- 4027 Glass Rd NE
- 3930 Red Cedar Dr NE
- 3930 Red Cedar Dr NE Unit B
- 3900 Belden Ct NE
- 3906 Belden Ct NE
- 3906 Red Cedar Dr NE
- 3910 Red Cedar Dr NE
- 4010 Red Cedar Dr NE
- 4010 Red Cedar Dr NE
- 4010 Red Cedar Dr NE Unit A
- 3625 Timberline Dr NE Unit 3
- 3869 Belden Ct NE