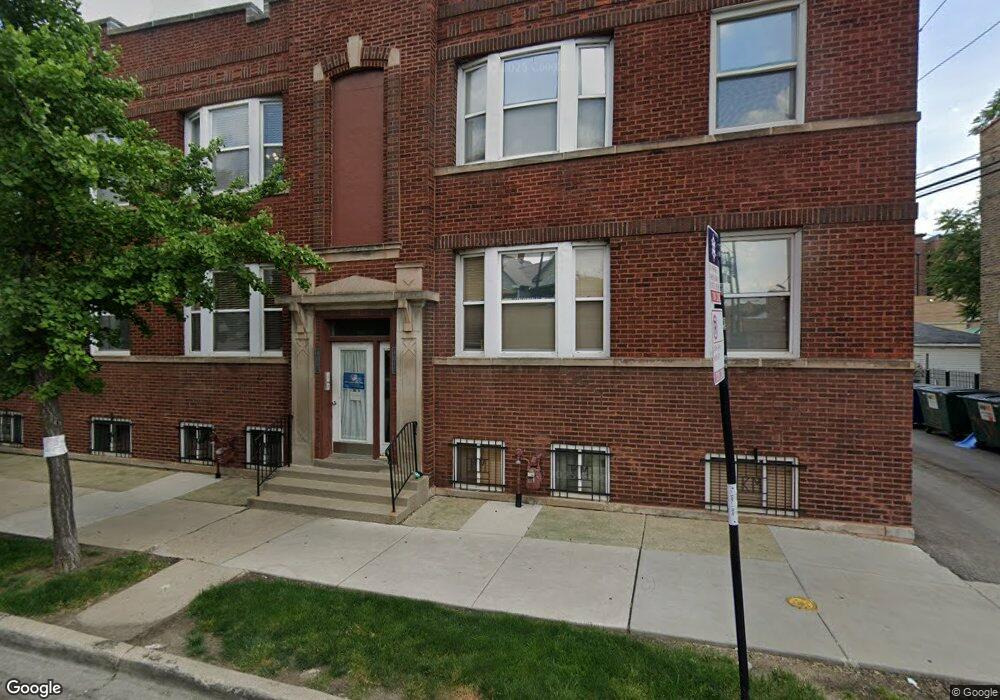
4015 N Kimball Ave Chicago, IL 60618
Irving Park NeighborhoodEstimated Value: $374,000 - $459,000
2
Beds
3
Baths
2,200
Sq Ft
$185/Sq Ft
Est. Value
About This Home
This home is located at 4015 N Kimball Ave, Chicago, IL 60618 and is currently estimated at $406,718, approximately $184 per square foot. 4015 N Kimball Ave is a home located in Cook County with nearby schools including Henry Elementary School, Roosevelt High School, and CICS Irving Park.
Ownership History
Date
Name
Owned For
Owner Type
Purchase Details
Closed on
Dec 22, 2015
Sold by
Downey David A and Downey Jacinda J
Bought by
Bielke William and Bielke Elizabeth
Current Estimated Value
Home Financials for this Owner
Home Financials are based on the most recent Mortgage that was taken out on this home.
Original Mortgage
$192,000
Outstanding Balance
$80,446
Interest Rate
3.96%
Mortgage Type
New Conventional
Estimated Equity
$326,272
Purchase Details
Closed on
Feb 15, 2010
Sold by
Downey Jacinda J and Downey David A
Bought by
Downey David A and Downey Jacinda J
Purchase Details
Closed on
Jul 19, 2007
Sold by
Schwartz Philip and Schwartz Jennifer A
Bought by
Johnson Jacinda
Home Financials for this Owner
Home Financials are based on the most recent Mortgage that was taken out on this home.
Original Mortgage
$255,200
Interest Rate
6.5%
Mortgage Type
Unknown
Purchase Details
Closed on
Mar 27, 2000
Sold by
Parkway Bank & Trust Company
Bought by
Schwartz Philip and Hough Jennifer A
Create a Home Valuation Report for This Property
The Home Valuation Report is an in-depth analysis detailing your home's value as well as a comparison with similar homes in the area
Home Values in the Area
Average Home Value in this Area
Purchase History
| Date | Buyer | Sale Price | Title Company |
|---|---|---|---|
| Bielke William | $240,000 | Saturn Title Llc | |
| Downey David A | -- | None Available | |
| Johnson Jacinda | $319,000 | Baird & Warner Title Service | |
| Schwartz Philip | $201,500 | -- |
Source: Public Records
Mortgage History
| Date | Status | Borrower | Loan Amount |
|---|---|---|---|
| Open | Bielke William | $192,000 | |
| Previous Owner | Johnson Jacinda | $255,200 |
Source: Public Records
Tax History Compared to Growth
Tax History
| Year | Tax Paid | Tax Assessment Tax Assessment Total Assessment is a certain percentage of the fair market value that is determined by local assessors to be the total taxable value of land and additions on the property. | Land | Improvement |
|---|---|---|---|---|
| 2024 | $4,803 | $34,162 | $8,855 | $25,307 |
| 2023 | $4,661 | $26,000 | $7,141 | $18,859 |
| 2022 | $4,661 | $26,000 | $7,141 | $18,859 |
| 2021 | $4,573 | $25,999 | $7,141 | $18,858 |
| 2020 | $3,883 | $20,474 | $3,142 | $17,332 |
| 2019 | $4,146 | $23,999 | $3,142 | $20,857 |
| 2018 | $4,075 | $23,999 | $3,142 | $20,857 |
| 2017 | $2,147 | $13,315 | $2,856 | $10,459 |
| 2016 | $2,174 | $13,315 | $2,856 | $10,459 |
| 2015 | $1,966 | $13,315 | $2,856 | $10,459 |
| 2014 | $3,004 | $18,699 | $2,570 | $16,129 |
| 2013 | $2,933 | $18,699 | $2,570 | $16,129 |
Source: Public Records
Map
Nearby Homes
- 4026 N Kimball Ave
- 3940 N Christiana Ave
- 4018 N Spaulding Ave Unit 2
- 3923 N Bernard St
- 3925 N Saint Louis Ave
- 3908 N Bernard St
- 4155 N Bernard St Unit G
- 3911 N Saint Louis Ave
- 3934 N Sawyer Ave
- 3223 W Belle Plaine Ave
- 4143 N Drake Ave
- 3855 N Christiana Ave
- 3551 W Belle Plaine Ave Unit 2
- 3558 W Belle Plaine Ave Unit 3
- 3903 N Drake Ave
- 3247 W Berteau Ave
- 4203 N Drake Ave
- 3853 N Spaulding Ave
- 4207 N Drake Ave
- 4116 N Kedzie Ave
- 4015 N Kimball Ave Unit 4015
- 4019 N Kimball Ave Unit 4019
- 4015 N Kimball Ave
- 4015 N Kimball Ave
- 4021 N Kimball Ave Unit 4021
- 4021 N Kimball Ave Unit 1
- 4017 N Kimball Ave Unit 4017
- 4025 N Kimball Ave Unit 40252
- 4025 N Kimball Ave Unit 40251
- 4025 N Kimball Ave Unit 2
- 4025 N Kimball Ave
- 4025 N Kimball Ave Unit 1
- 3351 W Cuyler Ave
- 3351 W Cuyler Ave
- 3349 W Cuyler Ave Unit 1
- 3349 W Cuyler Ave
- 3349 W Cuyler Ave Unit G
- 3349 W Cuyler Ave
- 3345 W Cuyler Ave
- 3341 W Cuyler Ave