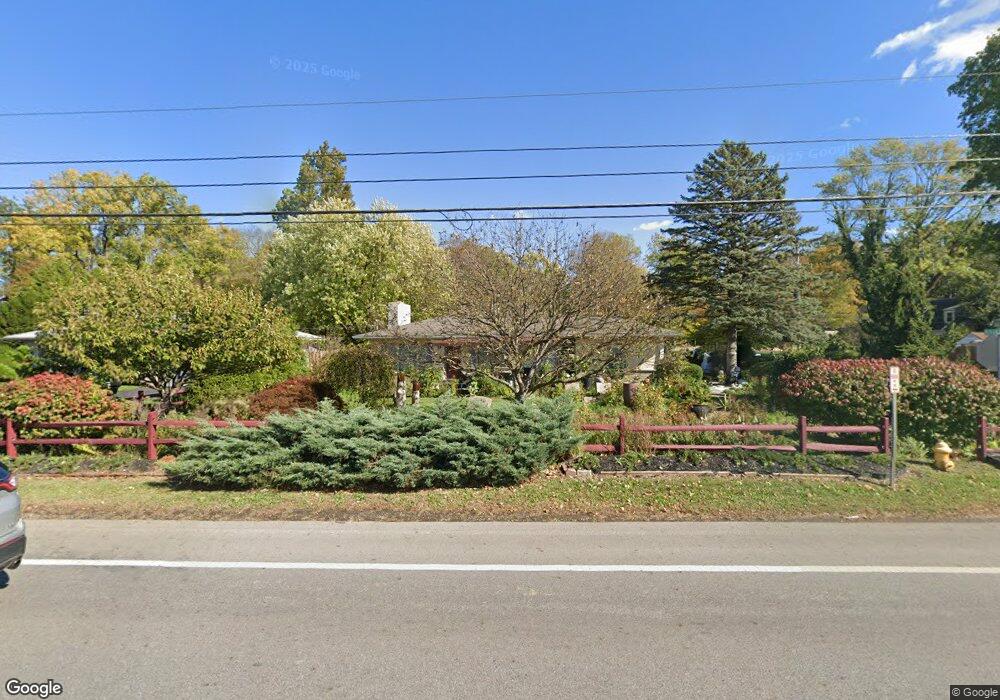
4016 Riverside Dr Columbus, OH 43220
Estimated Value: $415,397 - $553,000
2
Beds
1
Bath
1,328
Sq Ft
$357/Sq Ft
Est. Value
About This Home
This home is located at 4016 Riverside Dr, Columbus, OH 43220 and is currently estimated at $474,099, approximately $357 per square foot. 4016 Riverside Dr is a home located in Franklin County with nearby schools including Windermere Elementary School, Hastings Middle School, and Upper Arlington High School.
Ownership History
Date
Name
Owned For
Owner Type
Purchase Details
Closed on
Mar 25, 2004
Sold by
Space Patricia A
Bought by
Inpanbutr Nongnuch
Current Estimated Value
Purchase Details
Closed on
Mar 19, 2004
Sold by
Space John D and Space John
Bought by
Space Patricia A
Purchase Details
Closed on
Aug 30, 2002
Sold by
Fellows John R and Fellows John Richard
Bought by
Space John D
Home Financials for this Owner
Home Financials are based on the most recent Mortgage that was taken out on this home.
Original Mortgage
$116,700
Interest Rate
6.75%
Mortgage Type
Purchase Money Mortgage
Purchase Details
Closed on
May 23, 2002
Sold by
Estate Of Gladys J Fellows
Bought by
Fellows John Richard
Purchase Details
Closed on
May 26, 1962
Bought by
Fellows Gladys J
Create a Home Valuation Report for This Property
The Home Valuation Report is an in-depth analysis detailing your home's value as well as a comparison with similar homes in the area
Home Values in the Area
Average Home Value in this Area
Purchase History
| Date | Buyer | Sale Price | Title Company |
|---|---|---|---|
| Inpanbutr Nongnuch | $197,000 | Amerititle Agency Inc | |
| Space Patricia A | $173,900 | Amerititle Agency Inc | |
| Space John D | $145,900 | Chicago Title | |
| Fellows John Richard | -- | Gahanna Title | |
| Fellows Gladys J | -- | -- |
Source: Public Records
Mortgage History
| Date | Status | Borrower | Loan Amount |
|---|---|---|---|
| Previous Owner | Space John D | $116,700 |
Source: Public Records
Tax History
| Year | Tax Paid | Tax Assessment Tax Assessment Total Assessment is a certain percentage of the fair market value that is determined by local assessors to be the total taxable value of land and additions on the property. | Land | Improvement |
|---|---|---|---|---|
| 2025 | $7,955 | $134,130 | $68,430 | $65,700 |
| 2024 | $7,955 | $134,130 | $68,430 | $65,700 |
| 2023 | $8,068 | $134,120 | $68,425 | $65,695 |
| 2022 | $6,760 | $96,740 | $46,620 | $50,120 |
| 2021 | $6,298 | $96,740 | $46,620 | $50,120 |
| 2020 | $6,081 | $96,740 | $46,620 | $50,120 |
| 2019 | $5,713 | $82,390 | $46,620 | $35,770 |
| 2018 | $5,353 | $82,390 | $46,620 | $35,770 |
| 2017 | $5,263 | $82,390 | $46,620 | $35,770 |
| 2016 | $4,856 | $73,440 | $31,330 | $42,110 |
| 2015 | $4,852 | $73,440 | $31,330 | $42,110 |
| 2014 | $4,857 | $73,440 | $31,330 | $42,110 |
| 2013 | $2,320 | $66,780 | $28,490 | $38,290 |
Source: Public Records
Map
Nearby Homes
- 3830 Riverview Dr
- 3055 Carriage Ln
- 3450 River Rhone Ln
- 2411 Lytham Rd
- 3280 River Place Dr
- 2753 Shrewsbury Rd
- 4025 Dublin Rd
- 4270 Llanfair Ct
- 3338 Harbor Bay Dr
- 2458 Edgevale Rd
- 2674 Woodstock Rd
- 2413 Edgevale Rd
- 3276 Northampton Dr
- 2255 Haviland Rd
- 2480 Shrewsbury Rd
- 2900 Wickliffe Woods Ct
- 3434 Fishinger Rd
- 2401 Shrewsbury Rd
- 2272 Fishinger Rd
- 4115 Woodbridge Rd
- 4024 Riverside Dr
- 2804 Lakinhurst Dr
- 4000 Riverside Dr
- 4032 Riverside Dr
- 2794 Lakinhurst Dr
- 0 Lakinhurst Dr
- 3990 Riverside Dr
- 2805 Lakinhurst Dr
- 4044 Riverside Dr
- 3988 Riverside Dr Unit THREE
- 2784 Lakinhurst Dr
- 2795 Lakinhurst Dr
- 3978 Riverside Dr Unit THREE
- 3978 Riverside Dr
- 3970 Riverside Dr Unit THREE
- 2775 Fairfax Dr
- 3962 Riverside Dr Unit THREE
- 2774 Lakinhurst Dr
- 2828 Edgewood Rd
- 2808 Edgewood Rd