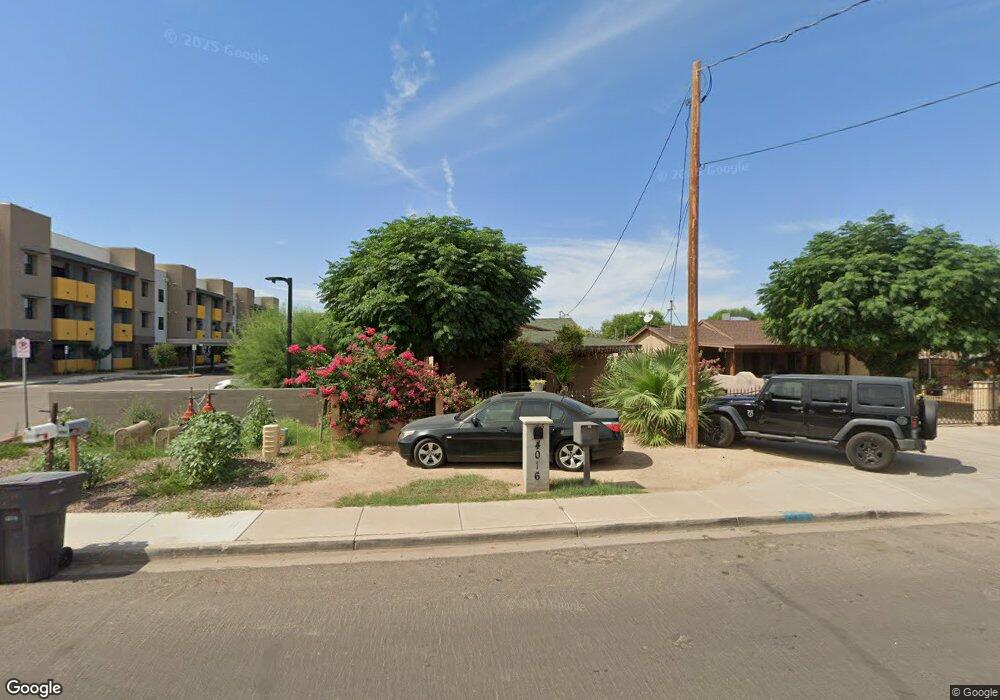
4016 S 9th St Phoenix, AZ 85040
South Mountain NeighborhoodEstimated Value: $252,000 - $317,000
--
Bed
1
Bath
1,220
Sq Ft
$225/Sq Ft
Est. Value
About This Home
This home is located at 4016 S 9th St, Phoenix, AZ 85040 and is currently estimated at $274,708, approximately $225 per square foot. 4016 S 9th St is a home located in Maricopa County with nearby schools including Irene Lopez School, South Mountain High School, and Phoenix Coding Academy.
Ownership History
Date
Name
Owned For
Owner Type
Purchase Details
Closed on
Jun 26, 2002
Sold by
Quintero Raul and Quintero Raul
Bought by
Aragon Ana Maria
Current Estimated Value
Home Financials for this Owner
Home Financials are based on the most recent Mortgage that was taken out on this home.
Original Mortgage
$79,055
Interest Rate
6.86%
Mortgage Type
Seller Take Back
Purchase Details
Closed on
Apr 16, 1999
Sold by
Anaya Isabell
Bought by
Quintero Raul and Quintero Raul
Purchase Details
Closed on
Dec 28, 1998
Sold by
Villanueva Eliseo and Villanueva Isabel
Bought by
Anaya Rudy and Anaya Isabell F
Purchase Details
Closed on
Mar 14, 1989
Sold by
Broniarczyk Casimir W and Broniarczyk Theresa M
Bought by
Villanueva Eliseo and Villanueva Isabel
Create a Home Valuation Report for This Property
The Home Valuation Report is an in-depth analysis detailing your home's value as well as a comparison with similar homes in the area
Home Values in the Area
Average Home Value in this Area
Purchase History
| Date | Buyer | Sale Price | Title Company |
|---|---|---|---|
| Aragon Ana Maria | $79,900 | Land Title Agency | |
| Quintero Raul | $34,000 | Century Title Agency Inc | |
| Anaya Rudy | $30,000 | Century Title Agency Inc | |
| Villanueva Eliseo | -- | Transamerica Title Ins Compa |
Source: Public Records
Mortgage History
| Date | Status | Borrower | Loan Amount |
|---|---|---|---|
| Previous Owner | Aragon Ana Maria | $79,055 |
Source: Public Records
Tax History
| Year | Tax Paid | Tax Assessment Tax Assessment Total Assessment is a certain percentage of the fair market value that is determined by local assessors to be the total taxable value of land and additions on the property. | Land | Improvement |
|---|---|---|---|---|
| 2025 | $1,445 | $10,690 | -- | -- |
| 2024 | $1,365 | $10,181 | -- | -- |
| 2023 | $1,365 | $17,910 | $3,580 | $14,330 |
| 2022 | $1,337 | $13,580 | $2,710 | $10,870 |
| 2021 | $340 | $9,760 | $1,950 | $7,810 |
| 2020 | $335 | $7,830 | $1,560 | $6,270 |
| 2019 | $324 | $6,530 | $1,300 | $5,230 |
| 2018 | $315 | $4,910 | $980 | $3,930 |
| 2017 | $293 | $4,020 | $800 | $3,220 |
| 2016 | $278 | $3,130 | $620 | $2,510 |
Source: Public Records
Map
Nearby Homes
- 1030 E Odeum Ln
- 3638 S 12th St
- 3638 S 12th St Unit 48
- 4003 S 12th St Unit 1
- 1235 E Wood St
- 4624 S 9th St
- 4439 S 6th St
- 1010 E Chipman Rd
- 1344 E Pueblo Ave
- 4016 S 12th St Unit 21
- 4028 S 15th St
- 1135 E Chipman Rd
- 4020 S 15th St
- 5011 S 6th Way
- 832 E Roeser Rd
- 710 E Atlanta Ave
- 5034 S 11th Place
- 502 E Roeser Rd
- 1409 E Bloch Rd
- 1250 E Roeser Rd
Your Personal Tour Guide
Ask me questions while you tour the home.