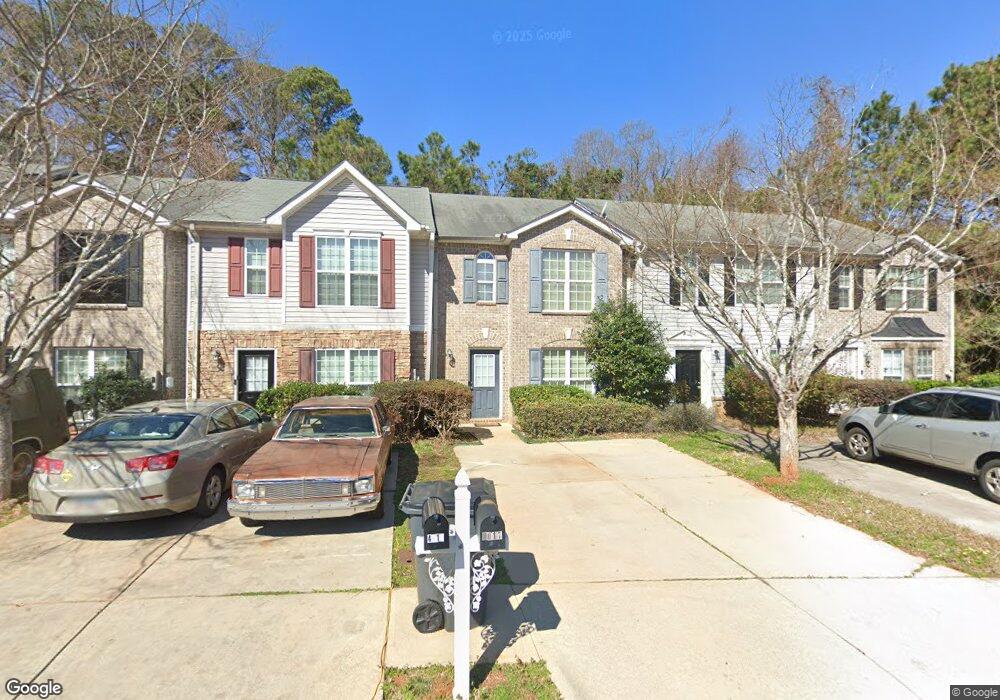
4017 Browne Ct Conley, GA 30288
Estimated Value: $192,000 - $205,000
3
Beds
3
Baths
1,444
Sq Ft
$138/Sq Ft
Est. Value
About This Home
This home is located at 4017 Browne Ct, Conley, GA 30288 and is currently estimated at $199,447, approximately $138 per square foot. 4017 Browne Ct is a home located in Clayton County with nearby schools including Huie Elementary School, Forest Park Middle School, and Forest Park High School.
Ownership History
Date
Name
Owned For
Owner Type
Purchase Details
Closed on
Nov 4, 2008
Sold by
Affordable Hsng Assistance Inc
Bought by
Wilson Glennis
Current Estimated Value
Home Financials for this Owner
Home Financials are based on the most recent Mortgage that was taken out on this home.
Original Mortgage
$73,727
Outstanding Balance
$48,468
Interest Rate
6.11%
Mortgage Type
FHA
Estimated Equity
$150,979
Purchase Details
Closed on
Aug 22, 2008
Sold by
Hud-Housing Of Urban Dev
Bought by
Affordable Hsng Assistance Inc
Home Financials for this Owner
Home Financials are based on the most recent Mortgage that was taken out on this home.
Original Mortgage
$59,900
Interest Rate
6.32%
Purchase Details
Closed on
Nov 6, 2007
Sold by
Chase Home Finance Llc
Bought by
Hud-Housing Of Urban Dev
Purchase Details
Closed on
Feb 2, 2006
Sold by
Dozier Homes Inc
Bought by
Bass Zephanias
Home Financials for this Owner
Home Financials are based on the most recent Mortgage that was taken out on this home.
Original Mortgage
$119,000
Interest Rate
6.21%
Mortgage Type
FHA
Create a Home Valuation Report for This Property
The Home Valuation Report is an in-depth analysis detailing your home's value as well as a comparison with similar homes in the area
Home Values in the Area
Average Home Value in this Area
Purchase History
| Date | Buyer | Sale Price | Title Company |
|---|---|---|---|
| Wilson Glennis | $74,700 | -- | |
| Affordable Hsng Assistance Inc | -- | -- | |
| Hud-Housing Of Urban Dev | -- | -- | |
| Chase Home Finance Llc | $132,225 | -- | |
| Bass Zephanias | $120,000 | -- |
Source: Public Records
Mortgage History
| Date | Status | Borrower | Loan Amount |
|---|---|---|---|
| Open | Wilson Glennis | $73,727 | |
| Previous Owner | Affordable Hsng Assistance Inc | $59,900 | |
| Previous Owner | Bass Zephanias | $119,000 |
Source: Public Records
Tax History Compared to Growth
Tax History
| Year | Tax Paid | Tax Assessment Tax Assessment Total Assessment is a certain percentage of the fair market value that is determined by local assessors to be the total taxable value of land and additions on the property. | Land | Improvement |
|---|---|---|---|---|
| 2024 | $2,563 | $74,720 | $5,600 | $69,120 |
| 2023 | $2,350 | $65,080 | $5,600 | $59,480 |
| 2022 | $1,586 | $49,440 | $5,600 | $43,840 |
| 2021 | $1,466 | $46,160 | $5,600 | $40,560 |
| 2020 | $1,042 | $35,107 | $5,600 | $29,507 |
| 2019 | $924 | $31,829 | $4,400 | $27,429 |
| 2018 | $947 | $22,400 | $4,400 | $18,000 |
| 2017 | $949 | $22,400 | $4,400 | $18,000 |
| 2016 | $949 | $23,319 | $4,400 | $18,919 |
| 2015 | $934 | $0 | $0 | $0 |
| 2014 | $678 | $16,079 | $4,400 | $11,679 |
Source: Public Records
Map
Nearby Homes
- 4031 Browne Ct
- 1497 Conley Way
- 4041 Browne Ct
- 4170 Thurman Rd
- 3970 Scott Dr
- 3975 Scott Dr
- 4156 Boling Dr
- 1216 Erica Way SE
- 1220 Erica Way SE
- 4082 Sweetbriar Ln
- 3881 Bonnie Ln SE
- 3851 Bonnie Ln SE
- 1409 Azalea Dr
- 996 Forest Valley Dr SE
- 3688 Chevington Ct SE
- 1112 Evelyn Dr
- 1054 MacKets Ct SE
- 4133 Conley Cir
- 4019 Browne Ct
- 4015 Browne Ct
- 4021 Browne Ct
- 4013 Browne Ct Unit I-68
- 4013 Browne Ct
- 4023 Browne Ct
- 4025 Browne Ct
- 4027 Browne Ct
- 4027 Browne Ct Unit 4027
- 4029 Browne Ct
- 4024 Browne Ct Unit 4024
- 4024 Browne Ct
- 4014 Browne Ct
- 4026 Browne Ct
- 4012 Browne Ct
- 4028 Browne Ct
- 4003 Browne Ct
- 1116 Shieldcrest Way
- 4033 Browne Ct
- 4010 Browne Ct