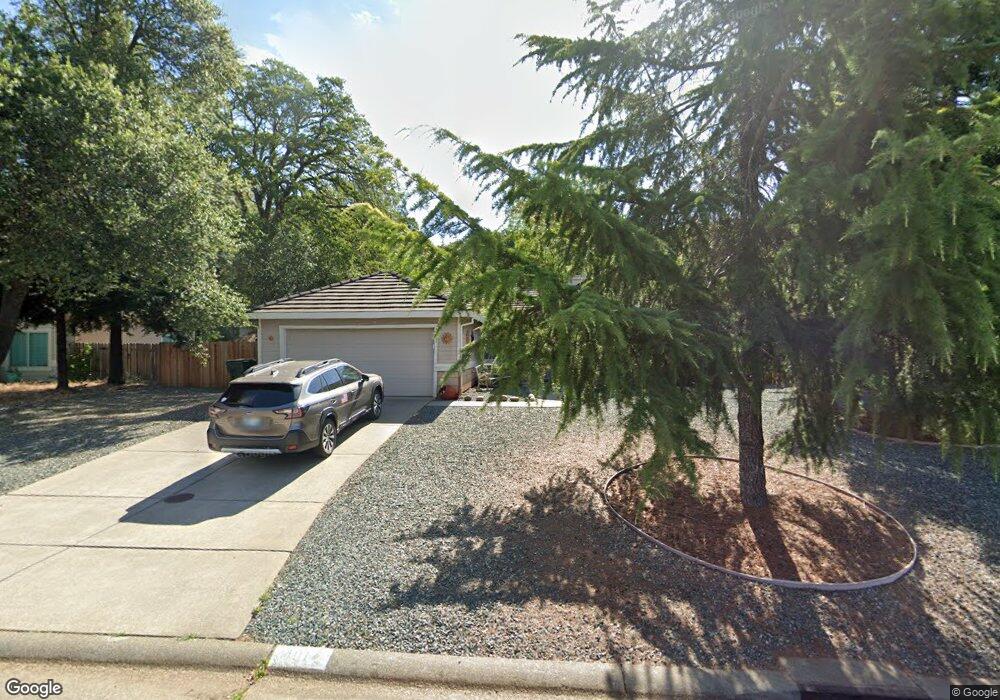
4017 Tea Rose Ct El Dorado Hills, CA 95762
Estimated Value: $541,011 - $641,000
3
Beds
2
Baths
1,237
Sq Ft
$482/Sq Ft
Est. Value
About This Home
This home is located at 4017 Tea Rose Ct, El Dorado Hills, CA 95762 and is currently estimated at $595,753, approximately $481 per square foot. 4017 Tea Rose Ct is a home located in El Dorado County with nearby schools including Green Valley Elementary School, Pleasant Grove Middle School, and Ponderosa High School.
Ownership History
Date
Name
Owned For
Owner Type
Purchase Details
Closed on
Dec 28, 2022
Sold by
Thompson Reed Debra
Bought by
Reed Debra Thompson and Gallardo Christopher
Current Estimated Value
Home Financials for this Owner
Home Financials are based on the most recent Mortgage that was taken out on this home.
Original Mortgage
$105,000
Interest Rate
6.61%
Purchase Details
Closed on
Sep 14, 1998
Sold by
Cross Kelly and Cross Jennifer
Bought by
Thompson Reed Debra
Home Financials for this Owner
Home Financials are based on the most recent Mortgage that was taken out on this home.
Original Mortgage
$124,000
Interest Rate
6.89%
Purchase Details
Closed on
Oct 21, 1997
Sold by
The Forecast Group Lp
Bought by
Cross Kelly and Cross Jennifer
Home Financials for this Owner
Home Financials are based on the most recent Mortgage that was taken out on this home.
Original Mortgage
$146,158
Interest Rate
7.49%
Mortgage Type
FHA
Create a Home Valuation Report for This Property
The Home Valuation Report is an in-depth analysis detailing your home's value as well as a comparison with similar homes in the area
Home Values in the Area
Average Home Value in this Area
Purchase History
| Date | Buyer | Sale Price | Title Company |
|---|---|---|---|
| Reed Debra Thompson | -- | Fidelity National Title | |
| Thompson Reed Debra | $155,000 | Placer Title Company | |
| Cross Kelly | $149,681 | First American Title Co |
Source: Public Records
Mortgage History
| Date | Status | Borrower | Loan Amount |
|---|---|---|---|
| Previous Owner | Reed Debra Thompson | $105,000 | |
| Previous Owner | Thompson Reed Debra | $124,000 | |
| Previous Owner | Cross Kelly | $146,158 |
Source: Public Records
Tax History Compared to Growth
Tax History
| Year | Tax Paid | Tax Assessment Tax Assessment Total Assessment is a certain percentage of the fair market value that is determined by local assessors to be the total taxable value of land and additions on the property. | Land | Improvement |
|---|---|---|---|---|
| 2025 | $2,798 | $242,962 | $86,206 | $156,756 |
| 2024 | $2,798 | $238,199 | $84,516 | $153,683 |
| 2023 | $2,470 | $233,529 | $82,859 | $150,670 |
| 2022 | $2,435 | $228,951 | $81,235 | $147,716 |
| 2021 | $2,705 | $224,463 | $79,643 | $144,820 |
| 2020 | $2,470 | $222,163 | $78,827 | $143,336 |
| 2019 | $2,431 | $217,808 | $77,282 | $140,526 |
| 2018 | $2,360 | $213,538 | $75,767 | $137,771 |
| 2017 | $2,324 | $209,352 | $74,282 | $135,070 |
| 2016 | $2,294 | $205,248 | $72,826 | $132,422 |
| 2015 | $2,219 | $202,167 | $71,733 | $130,434 |
| 2014 | $2,219 | $198,209 | $70,329 | $127,880 |
Source: Public Records
Map
Nearby Homes
- 3021 Robles Ct
- 423 Oeste Ln
- 4066 Plateau Cir
- 2780 Hillcrest Dr
- 4004 Prairie Falcon Dr
- 2512 Bass Lake Rd
- 2530 Sandpiper Way
- 0 Wilkinson Rd
- 0 Wilkinson Rd
- 3497 Lambeth Dr
- 3007 Cambridge Rd
- 2980 Calido Ct
- 3501 Mayfield Ct
- 5505 Crimson Ct
- 2876 Waverly Dr
- 5510 Crimson Ct
- 3180 Woodleigh Ln
- 2435 Sandpiper Way
- 1247 Senegal Way
- 3182 Birmingham Way
- 4013 Tea Rose Ct
- 3279 Tea Rose Dr
- 4009 Tea Rose Ct
- 3270 Tea Rose Dr
- 3285 Tea Rose Dr
- 3263 Tea Rose Dr
- 4010 Tea Rose Ct
- 4005 Tea Rose Ct
- 3284 Tea Rose Dr
- 3291 Tea Rose Dr
- 4004 Tea Rose Ct
- 4001 Tea Rose Ct
- 3292 Tea Rose Dr
- 4000 Tea Rose Ct
- 4002 Tea Rose Ct
- 3901 Watsonia Glen Dr
- 3297 Tea Rose Dr
- 3907 Watsonia Glen Dr
- 3911 Watsonia Glen Dr
- 3791 Watsonia Glen Dr