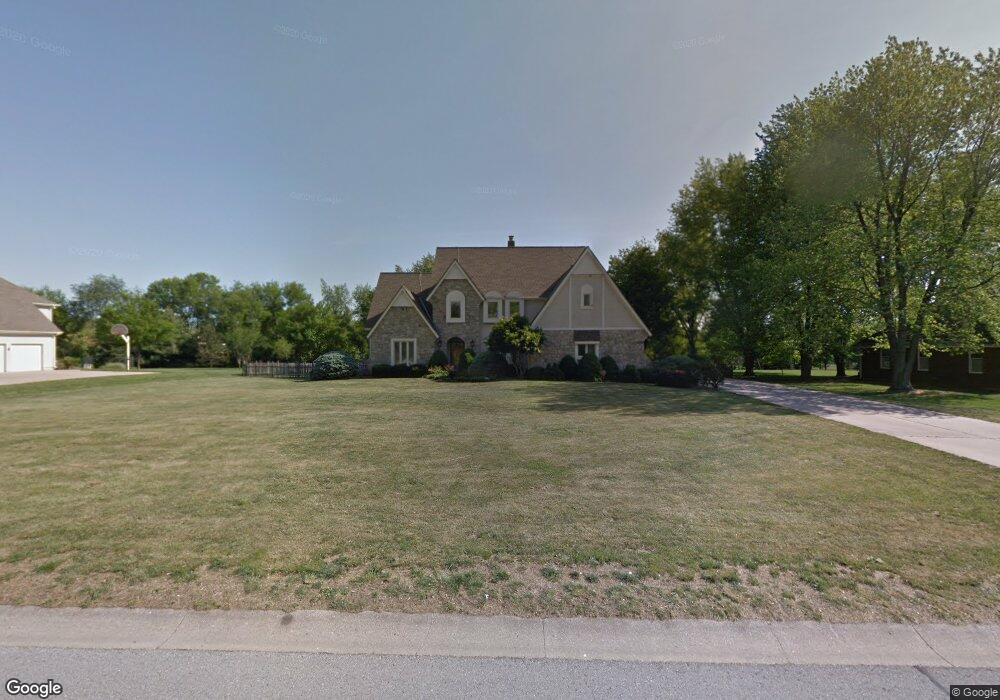
4017 W 138th Terrace Overland Park, KS 66224
Estimated Value: $711,000 - $818,000
4
Beds
4
Baths
3,548
Sq Ft
$216/Sq Ft
Est. Value
About This Home
This home is located at 4017 W 138th Terrace, Overland Park, KS 66224 and is currently estimated at $766,073, approximately $215 per square foot. 4017 W 138th Terrace is a home located in Johnson County with nearby schools including Prairie Star Elementary School, Prairie Star Middle School, and Blue Valley High School.
Ownership History
Date
Name
Owned For
Owner Type
Purchase Details
Closed on
Mar 21, 2022
Sold by
Cellitti Anthony P
Bought by
Cellitti Anthony P and Cellitti Janet L
Current Estimated Value
Purchase Details
Closed on
Feb 24, 2022
Sold by
Dorothy Cellitti Revocable Trust
Bought by
Cellitti Anthony P
Purchase Details
Closed on
Dec 30, 2021
Sold by
Monroe Diana D
Bought by
Cellitti Anthony P and Dorothy Cellitti Revocable Tru
Purchase Details
Closed on
Dec 29, 2021
Sold by
Tefft Mariella C
Bought by
Cellitti Anthony P and Dorothy Cellitti Revocable Tru
Purchase Details
Closed on
Nov 28, 2021
Sold by
Cellitti Nancy M and Estate Of Robert A Cellitti
Bought by
Cellitti Anthony P and Dorothy Cellitti Revocable Tru
Purchase Details
Closed on
Sep 8, 2014
Sold by
Cellitti Dorothy F
Bought by
Dorothy Cellitti Revocable Trust and Cellittip Anthony P
Purchase Details
Closed on
Oct 5, 2005
Sold by
Cellitti Louis P and Cellitti Dorothy E
Bought by
Cellitti Anthony P and Tefft Mariella C
Create a Home Valuation Report for This Property
The Home Valuation Report is an in-depth analysis detailing your home's value as well as a comparison with similar homes in the area
Home Values in the Area
Average Home Value in this Area
Purchase History
| Date | Buyer | Sale Price | Title Company |
|---|---|---|---|
| Cellitti Anthony P | -- | None Listed On Document | |
| Cellitti Anthony P | -- | Sage Law Llp | |
| Cellitti Anthony P | -- | None Available | |
| Cellitti Anthony P | -- | None Available | |
| Cellitti Anthony P | -- | None Available | |
| Cellitti Anthony P | -- | None Available | |
| Dorothy Cellitti Revocable Trust | -- | None Available | |
| Cellitti Anthony P | -- | None Available |
Source: Public Records
Tax History Compared to Growth
Tax History
| Year | Tax Paid | Tax Assessment Tax Assessment Total Assessment is a certain percentage of the fair market value that is determined by local assessors to be the total taxable value of land and additions on the property. | Land | Improvement |
|---|---|---|---|---|
| 2024 | $6,887 | $62,077 | $16,734 | $45,343 |
| 2023 | $7,073 | $62,779 | $16,734 | $46,045 |
| 2022 | $6,443 | $56,017 | $16,734 | $39,283 |
| 2021 | $6,368 | $52,820 | $16,734 | $36,086 |
| 2020 | $6,949 | $56,442 | $16,734 | $39,708 |
| 2019 | $6,120 | $48,863 | $14,546 | $34,317 |
| 2018 | $5,541 | $43,482 | $13,217 | $30,265 |
| 2017 | $4,848 | $40,124 | $11,490 | $28,634 |
| 2016 | $4,977 | $38,479 | $11,490 | $26,989 |
| 2015 | $4,965 | $37,916 | $11,490 | $26,426 |
| 2013 | -- | $36,547 | $10,427 | $26,120 |
Source: Public Records
Map
Nearby Homes
- 3811 W 138th St
- 13804 Alhambra St
- 4512 W 139th St
- 3849 W 139th Terrace
- 4520 W 140th St
- 4419 W 137th St
- 13614 Granada Dr
- 13611 Granada Dr
- 13810 Howe Ln
- 13806 Howe Ln
- 13802 Howe Ln
- 13801 Howe Ln
- 13623 Granada Dr
- 13626 Granada Dr
- 4410 W 136th Terrace
- 4406 W 136th Terrace
- 4407 W 136th Terrace
- 4403 W 136th Terrace
- 3905 W 142nd Dr
- 4423 W 136th St
- 4021 W 138th Terrace
- 4013 W 138th Terrace
- 4012 W 138th Terrace
- 4025 W 138th Terrace
- 4009 W 138th Terrace
- 4008 W 138th Terrace
- 3916 W 140th St
- 4016 W 138th Terrace
- 4002 W 140th St
- 3914 W 140th St
- 4004 W 138th Terrace
- 4013 W 138th St
- 4020 W 138th Terrace
- 4006 W 140th St
- 4009 W 138th St
- 4005 W 138th Terrace
- 13809 Fontana St
- 13813 Fontana St
- 4017 W 138th St
- 13901 Fontana St