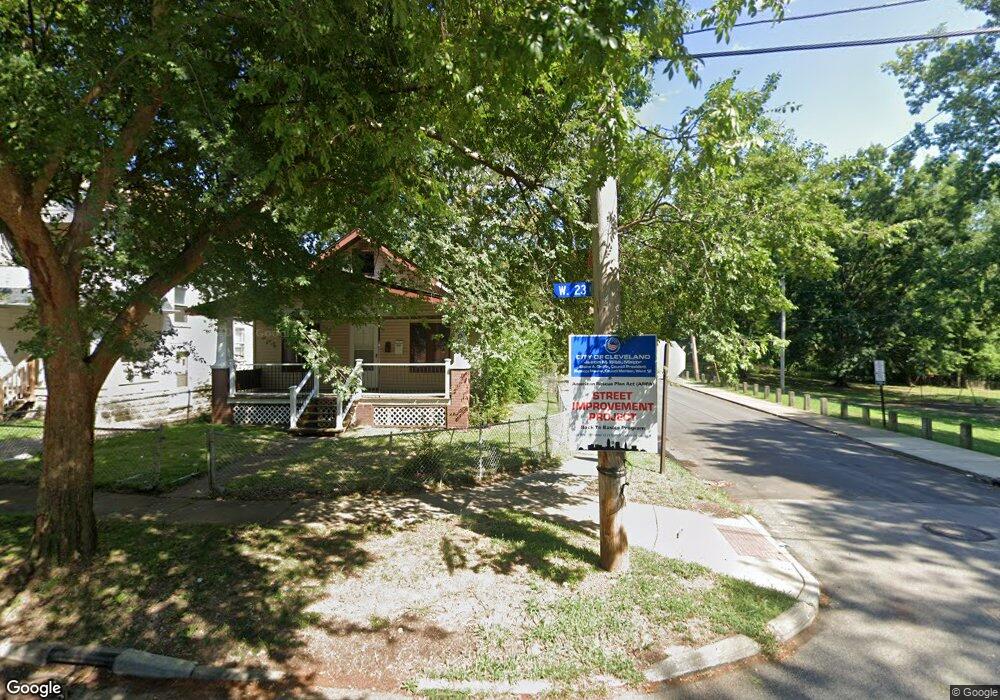
4017 W 23rd St Cleveland, OH 44109
Brooklyn Centre NeighborhoodEstimated Value: $90,134 - $153,000
3
Beds
2
Baths
1,740
Sq Ft
$63/Sq Ft
Est. Value
About This Home
This home is located at 4017 W 23rd St, Cleveland, OH 44109 and is currently estimated at $109,534, approximately $62 per square foot. 4017 W 23rd St is a home located in Cuyahoga County with nearby schools including Benjamin Franklin, Almira Academy, and Anton Grdina School.
Ownership History
Date
Name
Owned For
Owner Type
Purchase Details
Closed on
Dec 17, 2021
Sold by
Greenpointe Management Llc
Bought by
Quantum Ry Holdings Llc
Current Estimated Value
Purchase Details
Closed on
Dec 15, 2021
Sold by
Netherland Investment Group Llc
Bought by
Greenpointe Management Llc
Purchase Details
Closed on
Feb 22, 2021
Sold by
Criss Theresa M and Third Fsla Of Cleveland
Bought by
Netherland Investment Group Llc
Purchase Details
Closed on
Jun 14, 1991
Sold by
Cooper Louis C and Cooper Catherine
Bought by
Criss Theresa M
Purchase Details
Closed on
Apr 17, 1984
Sold by
Ries Anthony A
Bought by
Cooper Louis C and Cooper Catherine
Purchase Details
Closed on
Sep 28, 1983
Sold by
Guzik Teddy J
Bought by
Ries Anthony A
Purchase Details
Closed on
Dec 22, 1977
Sold by
Guzik Teddy J and Guzik Florence A
Bought by
Guzik Teddy J
Purchase Details
Closed on
Jan 1, 1975
Bought by
Guzik Teddy J and Guzik Florence A
Create a Home Valuation Report for This Property
The Home Valuation Report is an in-depth analysis detailing your home's value as well as a comparison with similar homes in the area
Home Values in the Area
Average Home Value in this Area
Purchase History
| Date | Buyer | Sale Price | Title Company |
|---|---|---|---|
| Quantum Ry Holdings Llc | $45,000 | Meridian Title | |
| Greenpointe Management Llc | $35,000 | New Title Company Name | |
| Netherland Investment Group Llc | $44,100 | None Available | |
| Criss Theresa M | $39,900 | -- | |
| Cooper Louis C | $32,900 | -- | |
| Ries Anthony A | $29,000 | -- | |
| Guzik Teddy J | -- | -- | |
| Guzik Teddy J | -- | -- |
Source: Public Records
Tax History Compared to Growth
Tax History
| Year | Tax Paid | Tax Assessment Tax Assessment Total Assessment is a certain percentage of the fair market value that is determined by local assessors to be the total taxable value of land and additions on the property. | Land | Improvement |
|---|---|---|---|---|
| 2024 | $1,872 | $28,000 | $6,720 | $21,280 |
| 2023 | $1,506 | $19,430 | $3,890 | $15,540 |
| 2022 | $1,803 | $19,425 | $3,885 | $15,540 |
| 2021 | $1,451 | $19,430 | $3,890 | $15,540 |
| 2020 | $1,300 | $15,050 | $3,010 | $12,040 |
| 2019 | $1,202 | $43,000 | $8,600 | $34,400 |
| 2018 | $1,250 | $15,050 | $3,010 | $12,040 |
| 2017 | $1,314 | $15,930 | $3,260 | $12,670 |
| 2016 | $1,303 | $15,930 | $3,260 | $12,670 |
| 2015 | $1,377 | $15,930 | $3,260 | $12,670 |
| 2014 | $1,377 | $16,770 | $3,430 | $13,340 |
Source: Public Records
Map
Nearby Homes
- 3947 W 22nd St
- 3891 W 21st St
- 1703 Crestline Ave
- 3847 W 19th St
- 4091 Valley Rd
- 1610 Crestline Ave
- 3900 W 33rd St
- 1511 Crestline Ave
- 4267 W 21st St
- 2404 Forestdale Ave
- 4226 Valley Rd
- 4233 Valley Rd
- 3890 W 36th St
- 1516 Amberley Ave
- 3889 W 37th St
- 4295 W 30th St
- 2609 Mapledale Ave
- 1905 Creston Ave
- 4302 W 30th St
- 2802 Colburn Ave
- 4013 W 23rd St
- 4013 W 23rd St Unit 1/DN
- 4016 W 23rd St
- 4009 W 23rd St
- 4005 W 23rd St
- 4002 W 22nd St
- 3998 W 22nd St
- 4001 W 23rd St
- 4006 W 22nd St
- 3994 W 22nd St
- 4010 W 23rd St
- 4008 W 23rd St
- 3997 W 23rd St
- 3990 W 22nd St
- 4020 W 23rd St
- 4002 W 23rd St
- 3993 W 23rd St
- 3993 W 23rd St Unit 2
- 3993 W 23rd St Unit 1
- 3986 W 22nd St