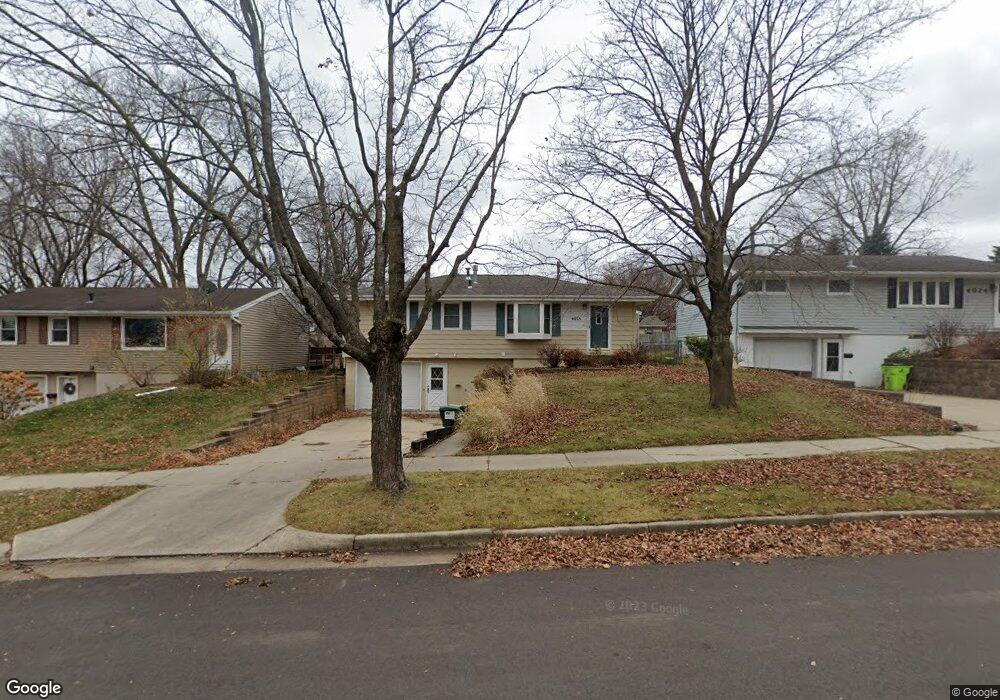
4018 7th Place NW Rochester, MN 55901
The Manor NeighborhoodEstimated Value: $275,000 - $297,000
4
Beds
2
Baths
1,647
Sq Ft
$175/Sq Ft
Est. Value
About This Home
This home is located at 4018 7th Place NW, Rochester, MN 55901 and is currently estimated at $287,779, approximately $174 per square foot. 4018 7th Place NW is a home located in Olmsted County with nearby schools including Bishop Elementary School, John Adams Middle School, and John Marshall Senior High School.
Ownership History
Date
Name
Owned For
Owner Type
Purchase Details
Closed on
May 19, 2022
Current Estimated Value
Purchase Details
Closed on
Apr 5, 2019
Sold by
Laan Danuel J and Laan Kimberly
Bought by
Scott Carter and Schumer Erin
Home Financials for this Owner
Home Financials are based on the most recent Mortgage that was taken out on this home.
Original Mortgage
$201,000
Interest Rate
3.62%
Mortgage Type
Adjustable Rate Mortgage/ARM
Purchase Details
Closed on
Mar 15, 2015
Sold by
Kramer Sarah B and Kramer Michael D
Bought by
Laan Danuel J
Home Financials for this Owner
Home Financials are based on the most recent Mortgage that was taken out on this home.
Original Mortgage
$154,500
Interest Rate
4.25%
Mortgage Type
Adjustable Rate Mortgage/ARM
Purchase Details
Closed on
Nov 21, 2005
Sold by
Schuh Dodge Jason E and Schuh Dodg E Rose M
Bought by
Kramer Sarah B and Kramer Michael D
Home Financials for this Owner
Home Financials are based on the most recent Mortgage that was taken out on this home.
Original Mortgage
$137,500
Interest Rate
6.2%
Mortgage Type
New Conventional
Create a Home Valuation Report for This Property
The Home Valuation Report is an in-depth analysis detailing your home's value as well as a comparison with similar homes in the area
Home Values in the Area
Average Home Value in this Area
Purchase History
| Date | Buyer | Sale Price | Title Company |
|---|---|---|---|
| -- | $275,100 | -- | |
| Scott Carter | $201,000 | Rochester Title | |
| Laan Danuel J | $154,500 | Rochester Title | |
| Kramer Sarah B | $140,000 | Burnet |
Source: Public Records
Mortgage History
| Date | Status | Borrower | Loan Amount |
|---|---|---|---|
| Previous Owner | Scott Carter | $201,000 | |
| Previous Owner | Laan Danuel J | $154,500 | |
| Previous Owner | Kramer Sarah B | $137,500 |
Source: Public Records
Tax History Compared to Growth
Tax History
| Year | Tax Paid | Tax Assessment Tax Assessment Total Assessment is a certain percentage of the fair market value that is determined by local assessors to be the total taxable value of land and additions on the property. | Land | Improvement |
|---|---|---|---|---|
| 2024 | $3,062 | $239,300 | $40,000 | $199,300 |
| 2023 | $2,652 | $225,200 | $40,000 | $185,200 |
| 2022 | $2,646 | $220,500 | $40,000 | $180,500 |
| 2021 | $2,542 | $192,300 | $30,000 | $162,300 |
| 2020 | $2,374 | $184,500 | $30,000 | $154,500 |
| 2019 | $2,246 | $183,100 | $30,000 | $153,100 |
| 2018 | $1,712 | $175,300 | $30,000 | $145,300 |
| 2017 | $1,636 | $144,700 | $20,000 | $124,700 |
| 2016 | $1,492 | $108,100 | $16,200 | $91,900 |
| 2015 | $1,404 | $96,200 | $15,700 | $80,500 |
| 2014 | $1,358 | $97,400 | $15,800 | $81,600 |
| 2012 | -- | $98,900 | $19,796 | $79,104 |
Source: Public Records
Map
Nearby Homes
- 3938 7th St NW
- 650 36th Ave NW
- 660 36th Ave NW
- 3586 6th St NW
- 4339 Manor Park Dr NW
- 468 Panorama Cir NW
- 700 Panorama Cir NW
- 3415 Lake St NW
- 4444 3rd St NW
- 4541 Ruby Ln NW
- 188 37th Ave NW
- 3304 Lake St NW
- 4119 Manor View Dr NW
- 803 50th Ave NW
- 4992 4th St NW
- 360 Wimbledon Hills Dr SW
- 3046 Jeremiah Ln NW
- 255x Heartland Dr NW
- 2535 Superior Ln NW
- 3324 Fox Hollow Ln SW
- 4012 7th Place NW
- 4024 7th Place NW
- 4004 7th Place NW
- 4005 6th St NW
- 4015 6th St NW
- 4032 7th Place NW
- 3943 6th St NW
- 4021 6th St NW
- 3944 7th Place NW
- 3937 6th St NW
- 4015 7th Place NW
- 4019 7th Place NW
- 4009 7th Place NW
- 4023 6th St NW
- 4025 7th Place NW
- 3938 7th Place NW
- 4031 7th Place NW
- 3931 6th St NW
- 3939 7th Place NW
- 4031 4031 6-Street-nw