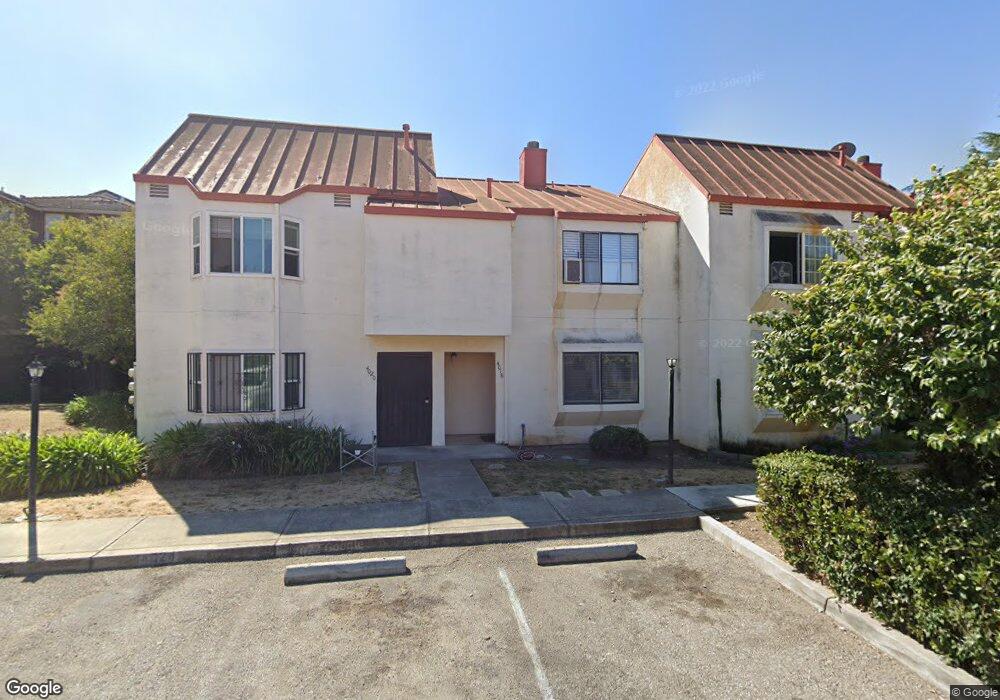
4018 Shanj Ct San Jose, CA 95127
Alum Rock NeighborhoodEstimated Value: $534,000 - $779,000
2
Beds
2
Baths
1,033
Sq Ft
$592/Sq Ft
Est. Value
About This Home
This home is located at 4018 Shanj Ct, San Jose, CA 95127 and is currently estimated at $611,218, approximately $591 per square foot. 4018 Shanj Ct is a home located in Santa Clara County with nearby schools including Linda Vista Elementary School, Joseph George Middle School, and James Lick High School.
Ownership History
Date
Name
Owned For
Owner Type
Purchase Details
Closed on
Jun 26, 2006
Sold by
Le Cau Xuan and Nguyen Tammy Tam
Bought by
Le Jean Cau Xuan and Nguyen Tammy Tam
Current Estimated Value
Purchase Details
Closed on
Mar 6, 2006
Sold by
Le Jean Cau Xuan and Nguyen Tammy
Bought by
Le Jean Cau Xuan and Nguyen Tammy
Home Financials for this Owner
Home Financials are based on the most recent Mortgage that was taken out on this home.
Original Mortgage
$180,000
Outstanding Balance
$101,789
Interest Rate
6.18%
Mortgage Type
New Conventional
Estimated Equity
$509,429
Purchase Details
Closed on
Jul 14, 1998
Sold by
Nguyen Kevin V and Le Cau Xuan
Bought by
Le Cau Xuan and Nguyen Tammy
Purchase Details
Closed on
Apr 21, 1997
Sold by
Flores Florentino P and Nguyen Tammy
Bought by
Nguyen Kevin and Le Cau Xuan
Home Financials for this Owner
Home Financials are based on the most recent Mortgage that was taken out on this home.
Original Mortgage
$82,500
Interest Rate
7.86%
Purchase Details
Closed on
Dec 6, 1993
Sold by
Bui Mai and Sprowls Robert J
Bought by
Flores Florentino P and Flores Cristina
Create a Home Valuation Report for This Property
The Home Valuation Report is an in-depth analysis detailing your home's value as well as a comparison with similar homes in the area
Home Values in the Area
Average Home Value in this Area
Purchase History
| Date | Buyer | Sale Price | Title Company |
|---|---|---|---|
| Le Jean Cau Xuan | -- | None Available | |
| Le Cau Xuan | -- | None Available | |
| Le Jean Cau Xuan | -- | Chicago Title Company Cu | |
| Le Cau Xuan | -- | -- | |
| Nguyen Kevin | $137,500 | Golden California Title Co | |
| Flores Florentino P | -- | -- |
Source: Public Records
Mortgage History
| Date | Status | Borrower | Loan Amount |
|---|---|---|---|
| Open | Le Jean Cau Xuan | $180,000 | |
| Closed | Nguyen Kevin | $82,500 |
Source: Public Records
Tax History Compared to Growth
Tax History
| Year | Tax Paid | Tax Assessment Tax Assessment Total Assessment is a certain percentage of the fair market value that is determined by local assessors to be the total taxable value of land and additions on the property. | Land | Improvement |
|---|---|---|---|---|
| 2025 | $3,948 | $229,115 | $102,616 | $126,499 |
| 2024 | $3,948 | $224,623 | $100,604 | $124,019 |
| 2023 | $3,851 | $220,220 | $98,632 | $121,588 |
| 2022 | $3,793 | $215,903 | $96,699 | $119,204 |
| 2021 | $3,663 | $211,670 | $94,803 | $116,867 |
| 2020 | $3,624 | $209,500 | $93,831 | $115,669 |
| 2019 | $3,538 | $205,393 | $91,992 | $113,401 |
| 2018 | $3,491 | $201,367 | $90,189 | $111,178 |
| 2017 | $3,495 | $197,420 | $88,421 | $108,999 |
| 2016 | $3,296 | $193,550 | $86,688 | $106,862 |
| 2015 | $3,278 | $190,643 | $85,386 | $105,257 |
| 2014 | $3,208 | $186,910 | $83,714 | $103,196 |
Source: Public Records
Map
Nearby Homes
- 3101 Starburst Ct
- 292 N Cragmont Ave
- 207 N Claremont Ave
- 3278 Faith Ct
- 160 Talmadge Ave
- 124 Cedar Ln
- 80 Pickford Ave
- 259 N Capitol Ave Unit 171
- 259 N Capitol Ave Unit 131
- 259 N Capitol Ave Unit 116
- 0 Gordon Blvd Unit FR25034343
- 0 Gordon Blvd Unit 625465
- 0 Gordon Blvd Unit 231524
- 0 Gordon Blvd Unit SR23111317
- 274 Vista Ave
- 247 N Capitol Ave Unit 235
- 247 N Capitol Ave Unit 105
- 636 Gridley St
- 75 S Cragmont Ave
- 58 Clareview Ave
- 4016 Shanj Ct
- 4020 Shanj Ct
- 4014 Shanj Ct
- 3125 Starburst Ct
- 3131 Starburst Ct
- 3137 Starburst Ct
- 4012 Shanj Ct
- 3119 Starburst Ct
- 4010 Shanj Ct
- 3113 Starburst Ct
- 4026 Shanj Ct
- 4024 Shanj Ct
- 4022 Shanj Ct
- 3162 Starburst Ct
- 3107 Starburst Ct
- 3156 Starburst Ct
- 4028 Shanj Ct
- 4030 Shanj Ct
- 3150 Starburst Ct
- 3144 Starburst Ct