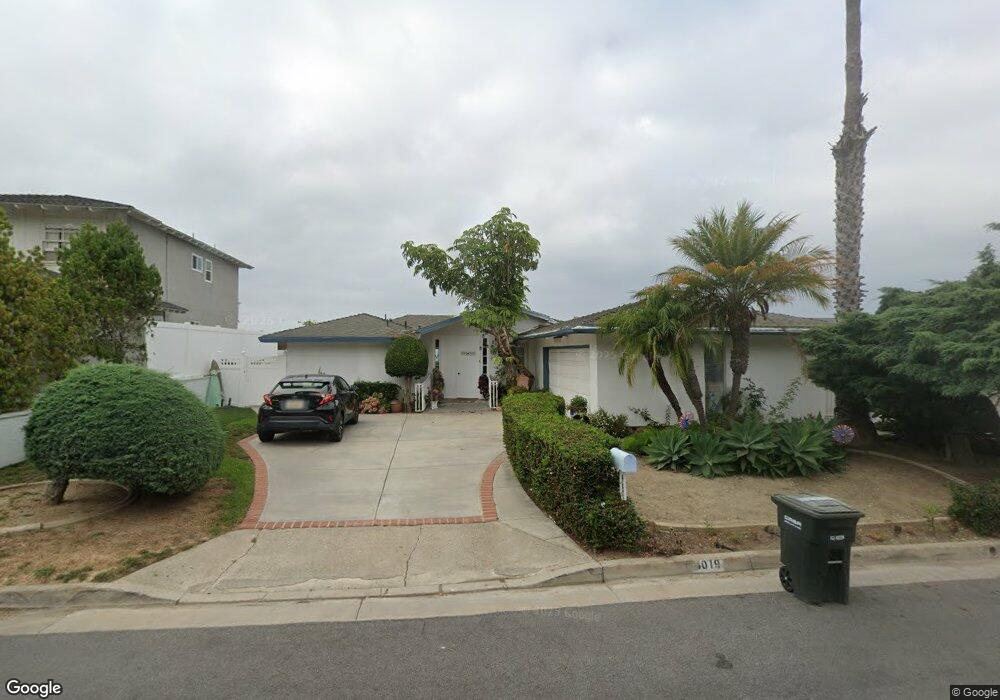
4019 Via Manzana San Clemente, CA 92673
Estimated Value: $1,648,855 - $1,992,000
2
Beds
2
Baths
2,319
Sq Ft
$769/Sq Ft
Est. Value
About This Home
This home is located at 4019 Via Manzana, San Clemente, CA 92673 and is currently estimated at $1,782,214, approximately $768 per square foot. 4019 Via Manzana is a home located in Orange County with nearby schools including Palisades Elementary School, Shorecliffs Middle School, and San Juan Hills High School.
Ownership History
Date
Name
Owned For
Owner Type
Purchase Details
Closed on
Apr 10, 2003
Sold by
Oliva Philip V
Bought by
Oliva Mariza M
Current Estimated Value
Home Financials for this Owner
Home Financials are based on the most recent Mortgage that was taken out on this home.
Original Mortgage
$487,500
Interest Rate
5.6%
Purchase Details
Closed on
Apr 9, 2003
Sold by
Gaurano Luis G and Gaurano Valerie R
Bought by
Oliva Mariza M
Home Financials for this Owner
Home Financials are based on the most recent Mortgage that was taken out on this home.
Original Mortgage
$487,500
Interest Rate
5.6%
Purchase Details
Closed on
Feb 21, 2002
Sold by
Gaurano Luis G and Gaurano Valerie R
Bought by
Gaurano Luis G and Gaurano Valerie R
Home Financials for this Owner
Home Financials are based on the most recent Mortgage that was taken out on this home.
Original Mortgage
$399,950
Interest Rate
6.8%
Create a Home Valuation Report for This Property
The Home Valuation Report is an in-depth analysis detailing your home's value as well as a comparison with similar homes in the area
Home Values in the Area
Average Home Value in this Area
Purchase History
| Date | Buyer | Sale Price | Title Company |
|---|---|---|---|
| Oliva Mariza M | -- | American Title Co | |
| Oliva Mariza M | $650,000 | American Title Co | |
| Gaurano Luis G | -- | Fidelity National Title Co |
Source: Public Records
Mortgage History
| Date | Status | Borrower | Loan Amount |
|---|---|---|---|
| Previous Owner | Oliva Mariza M | $487,500 | |
| Previous Owner | Gaurano Luis G | $399,950 |
Source: Public Records
Tax History Compared to Growth
Tax History
| Year | Tax Paid | Tax Assessment Tax Assessment Total Assessment is a certain percentage of the fair market value that is determined by local assessors to be the total taxable value of land and additions on the property. | Land | Improvement |
|---|---|---|---|---|
| 2025 | $10,505 | $924,158 | $751,334 | $172,824 |
| 2024 | $10,505 | $906,038 | $736,602 | $169,436 |
| 2023 | $10,170 | $888,273 | $722,159 | $166,114 |
| 2022 | $9,872 | $870,856 | $707,999 | $162,857 |
| 2021 | $9,638 | $853,781 | $694,117 | $159,664 |
| 2020 | $9,433 | $845,027 | $687,000 | $158,027 |
| 2019 | $9,240 | $828,458 | $673,529 | $154,929 |
| 2018 | $9,031 | $812,214 | $660,322 | $151,892 |
| 2017 | $8,819 | $796,289 | $647,375 | $148,914 |
| 2016 | $8,523 | $780,676 | $634,681 | $145,995 |
| 2015 | $8,661 | $768,950 | $625,147 | $143,803 |
| 2014 | $8,512 | $753,888 | $612,901 | $140,987 |
Source: Public Records
Map
Nearby Homes
- 4103 Calle Bienvenido
- 27062 Calle Juanita
- 34101 Via California Unit 12
- 26591 Via California
- 3813 Via Manzana
- 715 Calle Camisa
- 3807 Via Manzana
- 34561 Calle Portola
- 26666 Vuelta Loma
- 33741 Paseo de Decora
- 33801 Glocamora Ln
- 34555 Camino el Molino
- 34605 Calle Portola
- 3703 Calle la Quinta
- 27002 Avenida Las Palmas
- 26572 Paseo Callado
- 34671 Calle Rosita
- 0 Via Canon Unit SR24226749
- 3 Via Pasa
- 3 Calle Agua
- 4021 Via Manzana
- 4017 Via Manzana
- 4023 Via Manzana
- 4015 Via Manzana
- 4101 Calle Bienvenido
- 4017 Calle Bienvenido
- 4019 Calle Juno
- 4021 Calle Juno
- 4015 Calle Bienvenido
- 4017 Calle Juno
- 4023 Calle Juno
- 4011 Via Manzana
- 4015 Calle Juno
- 4013 Calle Bienvenido
- 4013 Calle Juno
- 4105 Calle Bienvenido
- 4051 Via Manzana
- 4009 Via Manzana
- 4020 Calle Bienvenido