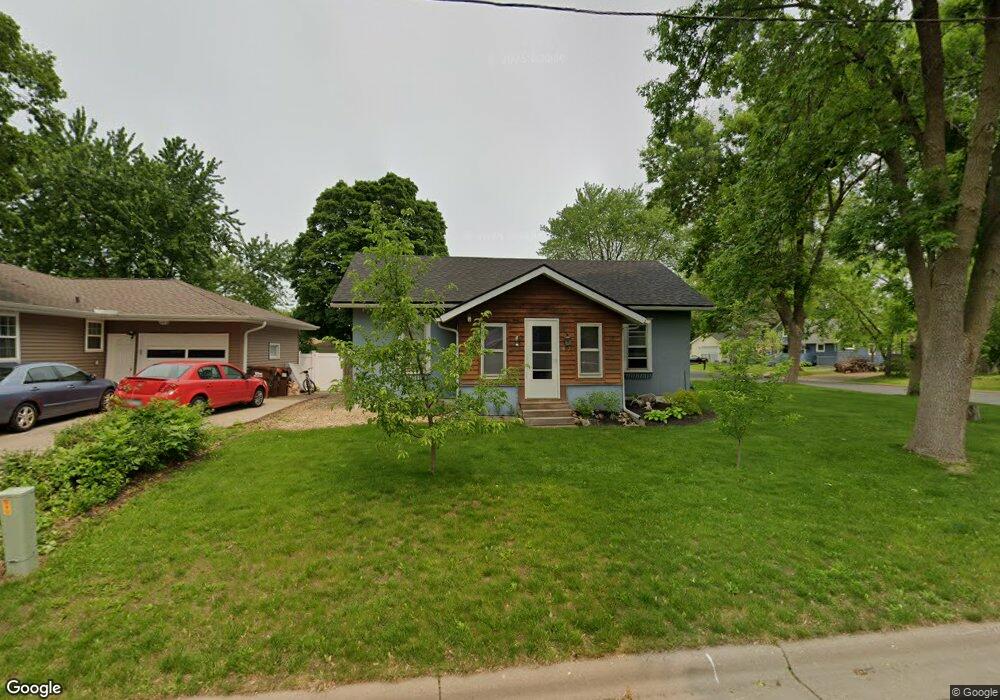
402 18th St W Hastings, MN 55033
Hastings-Marshan Township NeighborhoodEstimated Value: $304,000 - $442,000
3
Beds
2
Baths
942
Sq Ft
$364/Sq Ft
Est. Value
About This Home
This home is located at 402 18th St W, Hastings, MN 55033 and is currently estimated at $342,516, approximately $363 per square foot. 402 18th St W is a home located in Dakota County with nearby schools including Pinecrest Elementary School, Hastings Middle School, and Hastings High School.
Ownership History
Date
Name
Owned For
Owner Type
Purchase Details
Closed on
Sep 5, 2017
Sold by
Scharmer Brandon and Scharmer Mackenzie
Bought by
Gunderson Ashley
Current Estimated Value
Home Financials for this Owner
Home Financials are based on the most recent Mortgage that was taken out on this home.
Original Mortgage
$220,924
Outstanding Balance
$186,965
Interest Rate
4.5%
Mortgage Type
FHA
Estimated Equity
$155,552
Purchase Details
Closed on
Aug 31, 2015
Sold by
Appert Niles and Appert Megan
Bought by
Scharmer Brandon
Home Financials for this Owner
Home Financials are based on the most recent Mortgage that was taken out on this home.
Original Mortgage
$178,762
Interest Rate
3.97%
Mortgage Type
VA
Purchase Details
Closed on
May 30, 2003
Sold by
Kasel Barbara
Bought by
Appert Diles T
Purchase Details
Closed on
Dec 21, 2001
Sold by
The Estate Of Bernard J Kasel
Bought by
Kasel Barbara T
Create a Home Valuation Report for This Property
The Home Valuation Report is an in-depth analysis detailing your home's value as well as a comparison with similar homes in the area
Home Values in the Area
Average Home Value in this Area
Purchase History
| Date | Buyer | Sale Price | Title Company |
|---|---|---|---|
| Gunderson Ashley | $255,000 | Arden Title Llc | |
| Scharmer Brandon | $175,000 | Dca Title | |
| Appert Diles T | $200,000 | -- | |
| Kasel Barbara T | $138,000 | -- |
Source: Public Records
Mortgage History
| Date | Status | Borrower | Loan Amount |
|---|---|---|---|
| Open | Gunderson Ashley | $220,924 | |
| Previous Owner | Scharmer Brandon | $178,762 |
Source: Public Records
Tax History Compared to Growth
Tax History
| Year | Tax Paid | Tax Assessment Tax Assessment Total Assessment is a certain percentage of the fair market value that is determined by local assessors to be the total taxable value of land and additions on the property. | Land | Improvement |
|---|---|---|---|---|
| 2024 | $3,240 | $283,800 | $63,800 | $220,000 |
| 2023 | $3,240 | $289,700 | $63,900 | $225,800 |
| 2022 | $2,644 | $272,700 | $63,800 | $208,900 |
| 2021 | $2,534 | $228,300 | $55,400 | $172,900 |
| 2020 | $2,526 | $218,700 | $52,800 | $165,900 |
| 2019 | $2,374 | $211,500 | $49,100 | $162,400 |
| 2018 | $2,004 | $191,600 | $46,800 | $144,800 |
| 2017 | $1,871 | $161,400 | $44,600 | $116,800 |
| 2016 | $1,886 | $152,300 | $41,600 | $110,700 |
| 2015 | $1,850 | $126,260 | $34,006 | $92,254 |
| 2014 | -- | $124,625 | $32,646 | $91,979 |
| 2013 | -- | $109,910 | $28,658 | $81,252 |
Source: Public Records
Map
Nearby Homes
- 404 18th St W
- 406 18th St W
- 1708 Ashland St Unit 3
- 1708 Ashland St
- 320 18th St W
- 1800 Ashland St
- 1715 Forest St
- 1719 Ashland St
- 1719 1719 Ashland St
- 408 18th St W
- 403 17th St W
- 319 17th St W
- 409 17th St W
- 415 18th St W
- 1810 Ashland St
- 1803 Ashland St
- 1703 Forest St
- 317 17th St W
- 314 18th St W
- 2369 Old Bridge Ln