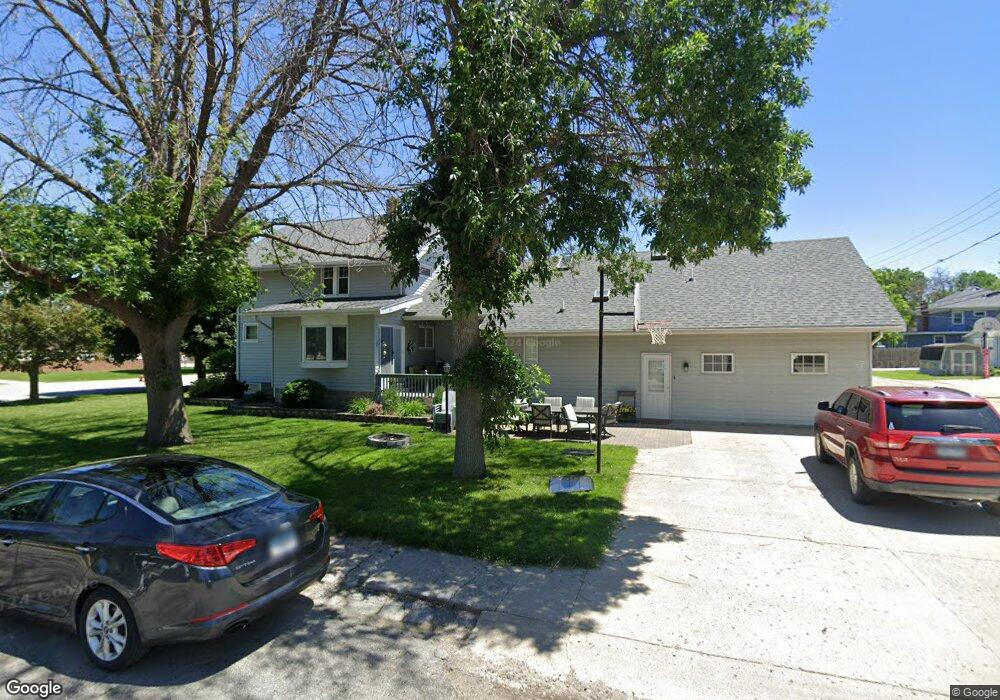
402 3rd Ave NE Clarion, IA 50525
Estimated Value: $163,000 - $190,779
4
Beds
4
Baths
2,788
Sq Ft
$65/Sq Ft
Est. Value
About This Home
This home is located at 402 3rd Ave NE, Clarion, IA 50525 and is currently estimated at $181,695, approximately $65 per square foot. 402 3rd Ave NE is a home located in Wright County with nearby schools including Clarion-Goldfield-Dows Elementary School, Clarion-Goldfield-Dows Middle School, and Clarion-Goldfield-Dows High School.
Ownership History
Date
Name
Owned For
Owner Type
Purchase Details
Closed on
Jul 25, 2014
Current Estimated Value
Purchase Details
Closed on
Nov 29, 2010
Sold by
Dorsey Edward D and Dorsey Carolyn M
Bought by
Berning Jason J and Berning Natalie E
Home Financials for this Owner
Home Financials are based on the most recent Mortgage that was taken out on this home.
Original Mortgage
$90,000
Outstanding Balance
$59,077
Interest Rate
4.17%
Mortgage Type
New Conventional
Estimated Equity
$122,618
Create a Home Valuation Report for This Property
The Home Valuation Report is an in-depth analysis detailing your home's value as well as a comparison with similar homes in the area
Home Values in the Area
Average Home Value in this Area
Purchase History
| Date | Buyer | Sale Price | Title Company |
|---|---|---|---|
| -- | -- | None Available | |
| Berning Jason J | $100,000 | None Available |
Source: Public Records
Mortgage History
| Date | Status | Borrower | Loan Amount |
|---|---|---|---|
| Open | Berning Jason J | $90,000 |
Source: Public Records
Tax History Compared to Growth
Tax History
| Year | Tax Paid | Tax Assessment Tax Assessment Total Assessment is a certain percentage of the fair market value that is determined by local assessors to be the total taxable value of land and additions on the property. | Land | Improvement |
|---|---|---|---|---|
| 2025 | $2,900 | $166,900 | $9,700 | $157,200 |
| 2024 | $2,900 | $161,600 | $9,700 | $151,900 |
| 2023 | $2,880 | $161,600 | $9,700 | $151,900 |
| 2022 | $2,402 | $136,300 | $9,700 | $126,600 |
| 2021 | $2,402 | $115,600 | $9,700 | $105,900 |
| 2020 | $2,389 | $116,200 | $9,700 | $106,500 |
| 2019 | $2,202 | $106,800 | $0 | $0 |
| 2018 | $2,214 | $106,800 | $0 | $0 |
| 2017 | $2,122 | $102,900 | $0 | $0 |
| 2016 | $2,032 | $102,900 | $0 | $0 |
| 2015 | $1,944 | $102,900 | $0 | $0 |
| 2014 | $1,944 | $114,600 | $0 | $0 |
Source: Public Records
Map
Nearby Homes
- 421 2nd Ave NE
- 212 3rd Ave NE
- 603 1st Ave NE
- 519 6th St NE
- 719 2nd St NE
- 620 Maple Ln
- 903 2nd Ave NE
- 1003 2nd Ave NE
- 213 8th St SE
- 219 8th Ave SE
- 306 White Fox Dr
- 1000 1st St SE
- 1221 S Main St
- 1513 2nd St SW
- 2412 188th St
- 2405 186th St Unit 1
- 2405 186th St Unit 2
- 1884 Obrien Ave
- 2189 Hancock Ave
- 2102 Taylor Ave