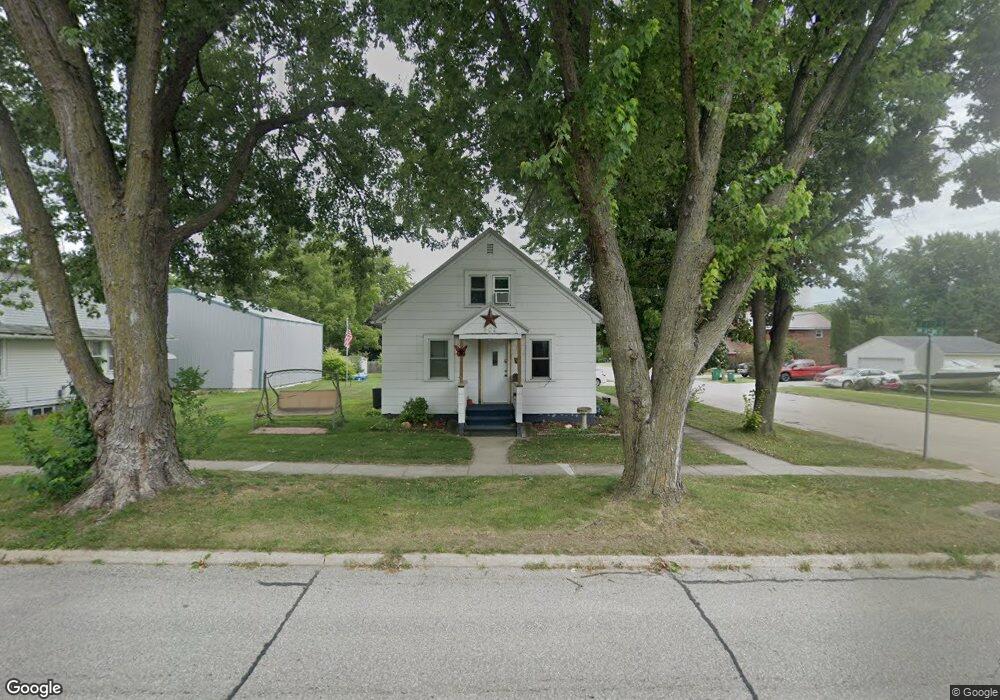
402 8th Ave NE Independence, IA 50644
Estimated Value: $118,000 - $152,000
3
Beds
6
Baths
950
Sq Ft
$147/Sq Ft
Est. Value
About This Home
This home is located at 402 8th Ave NE, Independence, IA 50644 and is currently estimated at $140,069, approximately $147 per square foot. 402 8th Ave NE is a home located in Buchanan County with nearby schools including West Elementary School, East Elementary School, and Independence Junior/Senior High School.
Ownership History
Date
Name
Owned For
Owner Type
Purchase Details
Closed on
Nov 18, 2011
Sold by
Neipi Llc
Bought by
Eldridge David G and Eldridge Wendy K
Current Estimated Value
Home Financials for this Owner
Home Financials are based on the most recent Mortgage that was taken out on this home.
Original Mortgage
$66,326
Outstanding Balance
$45,119
Interest Rate
3.97%
Mortgage Type
New Conventional
Estimated Equity
$94,950
Create a Home Valuation Report for This Property
The Home Valuation Report is an in-depth analysis detailing your home's value as well as a comparison with similar homes in the area
Home Values in the Area
Average Home Value in this Area
Purchase History
| Date | Buyer | Sale Price | Title Company |
|---|---|---|---|
| Eldridge David G | $65,000 | None Available |
Source: Public Records
Mortgage History
| Date | Status | Borrower | Loan Amount |
|---|---|---|---|
| Open | Eldridge David G | $66,326 |
Source: Public Records
Tax History Compared to Growth
Tax History
| Year | Tax Paid | Tax Assessment Tax Assessment Total Assessment is a certain percentage of the fair market value that is determined by local assessors to be the total taxable value of land and additions on the property. | Land | Improvement |
|---|---|---|---|---|
| 2025 | $1,346 | $96,800 | $12,830 | $83,970 |
| 2024 | $1,346 | $85,810 | $11,460 | $74,350 |
| 2023 | $1,296 | $85,810 | $11,460 | $74,350 |
| 2022 | $1,220 | $70,370 | $9,090 | $61,280 |
| 2021 | $1,214 | $70,370 | $9,090 | $61,280 |
| 2020 | $1,214 | $65,300 | $8,270 | $57,030 |
| 2019 | $1,206 | $65,300 | $8,270 | $57,030 |
| 2018 | $1,150 | $64,120 | $8,270 | $55,850 |
| 2017 | $1,166 | $64,120 | $8,270 | $55,850 |
| 2016 | $1,216 | $63,860 | $4,920 | $58,940 |
| 2015 | $1,216 | $63,860 | $4,920 | $58,940 |
| 2014 | $1,240 | $63,860 | $4,920 | $58,940 |
Source: Public Records
Map
Nearby Homes