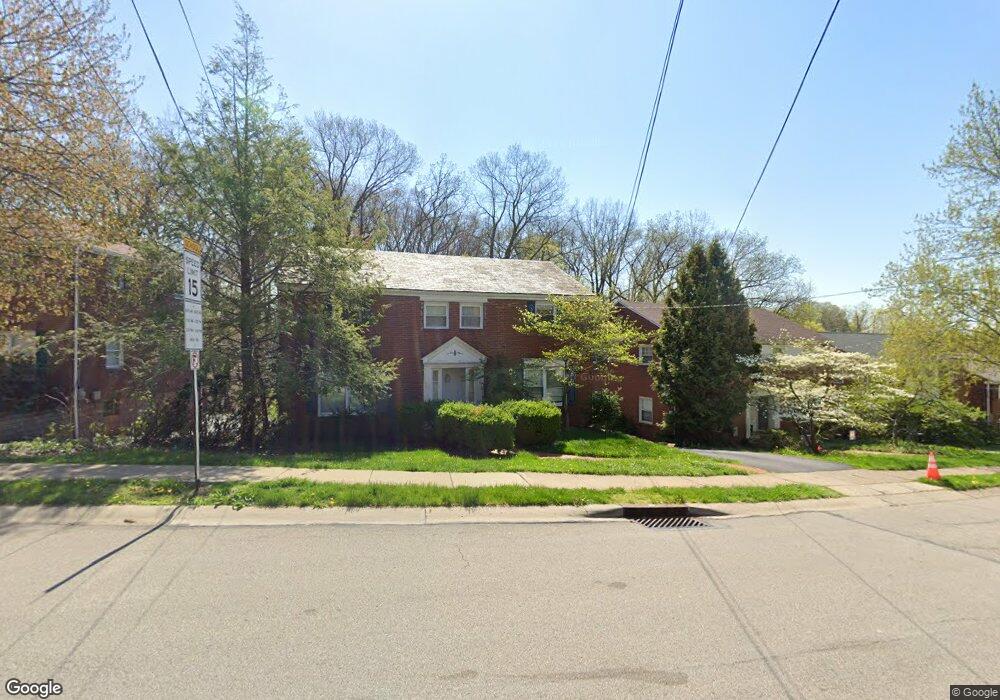
402 Anawanda Ave Pittsburgh, PA 15228
Estimated Value: $222,330 - $336,000
3
Beds
1
Bath
1,108
Sq Ft
$268/Sq Ft
Est. Value
About This Home
This home is located at 402 Anawanda Ave, Pittsburgh, PA 15228 and is currently estimated at $297,333, approximately $268 per square foot. 402 Anawanda Ave is a home located in Allegheny County with nearby schools including Howe Elementary School, Mellon Middle School, and Mt Lebanon Senior High School.
Ownership History
Date
Name
Owned For
Owner Type
Purchase Details
Closed on
Sep 4, 2024
Sold by
Dobson Bruce H
Bought by
Dobson Geoffrey B and Dobson Kevin W
Current Estimated Value
Purchase Details
Closed on
Aug 28, 2024
Sold by
Dobson Bruce H
Bought by
Dobson Geoffrey B and Dobson Kevin W
Purchase Details
Closed on
Aug 16, 2024
Sold by
Dobson Bruce H and Lee Ann
Bought by
Dobson Kevin W
Purchase Details
Closed on
Jul 2, 2008
Sold by
Cramer Matthew G
Bought by
Dobson Bruce H
Home Financials for this Owner
Home Financials are based on the most recent Mortgage that was taken out on this home.
Original Mortgage
$120,000
Interest Rate
6.13%
Mortgage Type
New Conventional
Purchase Details
Closed on
Jun 10, 1999
Sold by
Gillespie Edward M and Gillespie Christine L
Bought by
Cramer Matthew G and Gillespie Bonnie K
Purchase Details
Closed on
Oct 14, 1994
Sold by
Ryan E M
Bought by
Gillespie Edward Martin and Gillespie Christine L
Create a Home Valuation Report for This Property
The Home Valuation Report is an in-depth analysis detailing your home's value as well as a comparison with similar homes in the area
Home Values in the Area
Average Home Value in this Area
Purchase History
| Date | Buyer | Sale Price | Title Company |
|---|---|---|---|
| Dobson Geoffrey B | -- | -- | |
| Dobson Kevin W | -- | -- | |
| Dobson Bruce H | $150,000 | -- | |
| Cramer Matthew G | $115,000 | -- | |
| Gillespie Edward Martin | -- | -- | |
| Dobson Geoffrey B | -- | -- | |
| Dobson Geoffrey B | -- | -- |
Source: Public Records
Mortgage History
| Date | Status | Borrower | Loan Amount |
|---|---|---|---|
| Previous Owner | Dobson Bruce H | $120,000 |
Source: Public Records
Tax History Compared to Growth
Tax History
| Year | Tax Paid | Tax Assessment Tax Assessment Total Assessment is a certain percentage of the fair market value that is determined by local assessors to be the total taxable value of land and additions on the property. | Land | Improvement |
|---|---|---|---|---|
| 2025 | $3,038 | $82,500 | $30,100 | $52,400 |
| 2024 | $3,038 | $82,500 | $30,100 | $52,400 |
| 2023 | $2,972 | $82,500 | $30,100 | $52,400 |
| 2022 | $2,906 | $82,500 | $30,100 | $52,400 |
| 2021 | $2,890 | $82,500 | $30,100 | $52,400 |
| 2020 | $2,824 | $82,500 | $30,100 | $52,400 |
| 2019 | $2,785 | $82,500 | $30,100 | $52,400 |
| 2018 | $390 | $82,500 | $30,100 | $52,400 |
| 2017 | $2,753 | $82,500 | $30,100 | $52,400 |
| 2016 | $390 | $82,500 | $30,100 | $52,400 |
| 2015 | $390 | $82,500 | $30,100 | $52,400 |
| 2014 | $2,672 | $82,500 | $30,100 | $52,400 |
Source: Public Records
Map
Nearby Homes
- 409 Sunset Dr
- 871 Country Club Dr
- 290 Jonquil Place
- 207 Parkside Ave
- 229 Questend Ave
- 19 Thornwood Dr
- 586 Kenilworth Dr
- 552 Audubon Ave
- 619 Briarwood Ave
- 210 Adeline Ave
- 287 Sleepy Hollow Rd
- 256 Pennsylvania Blvd
- 472 Sleepy Hollow Rd
- 50 Brucewood Dr
- 216 Catalpa Place
- 461 Sleepy Hollow Rd
- 11 Earlswood Ave
- 216 Merion Dr
- 491 Haverhill Rd
- 721 Roselawn Ave Unit C5
- 404 Anawanda Ave
- 400 Anawanda Ave
- 398 Anawanda Ave
- 406 Anawanda Ave
- 406-408 Anawanda Ave
- 396 Anawanda Ave
- 394 Anawanda Ave Unit 396
- 407 Anawanda Ave
- 409 Anawanda Ave
- 403 Anawanda Ave Unit 405
- 390 Anawanda Ave Unit 392
- 411 Anawanda Ave Unit 413
- 399 Anawanda Ave Unit 401
- 410 Anawanda Ave
- 417 Anawanda Ave
- 415 Anawanda Ave Unit 417
- 391 Anawanda Ave Unit 395
- 384 Anawanda Ave Unit 386
- 419 Anawanda Ave
- 419 Anawanda Ave