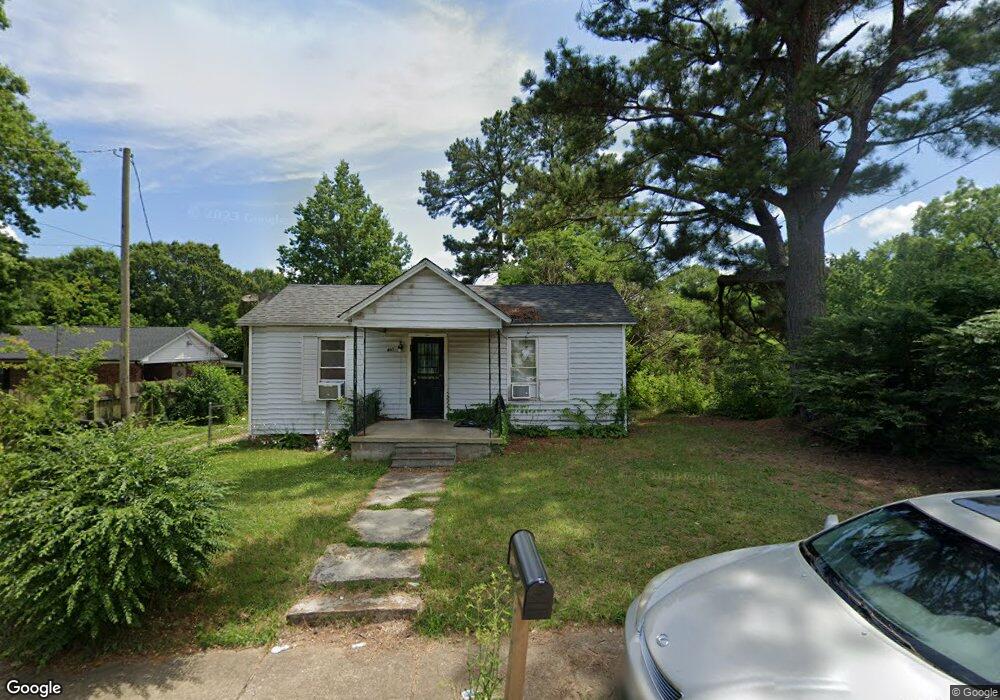
402 Berry St Jackson, TN 38301
Estimated Value: $63,000 - $109,000
3
Beds
2
Baths
1,230
Sq Ft
$65/Sq Ft
Est. Value
About This Home
This home is located at 402 Berry St, Jackson, TN 38301 and is currently estimated at $80,283, approximately $65 per square foot. 402 Berry St is a home located in Madison County with nearby schools including Lincoln Elementary School, North Parkway Middle School, and Liberty Technology Magnet High School.
Ownership History
Date
Name
Owned For
Owner Type
Purchase Details
Closed on
Jan 16, 2012
Sold by
Neward Llc
Bought by
Heritage Properties Llc
Current Estimated Value
Purchase Details
Closed on
Dec 12, 2007
Bought by
Neward Llc
Purchase Details
Closed on
Sep 15, 2005
Sold by
Fesmire Benny D Tr
Bought by
B&H Investments Inc
Purchase Details
Closed on
Aug 7, 2001
Sold by
Perry Bobby N
Bought by
Dorothy Mcneal
Home Financials for this Owner
Home Financials are based on the most recent Mortgage that was taken out on this home.
Original Mortgage
$27,000
Interest Rate
6.73%
Purchase Details
Closed on
Mar 1, 1999
Bought by
Mcneal Dorothy
Purchase Details
Closed on
May 19, 1986
Bought by
Perry Bobby N
Purchase Details
Closed on
May 16, 1986
Purchase Details
Closed on
Sep 13, 1956
Create a Home Valuation Report for This Property
The Home Valuation Report is an in-depth analysis detailing your home's value as well as a comparison with similar homes in the area
Purchase History
| Date | Buyer | Sale Price | Title Company |
|---|---|---|---|
| Heritage Properties Llc | $6,500 | -- | |
| Neward Llc | $30,000 | -- | |
| B&H Investments Inc | $5,000 | -- | |
| Dorothy Mcneal | $25,500 | -- | |
| Mcneal Dorothy | $25,500 | -- | |
| Perry Bobby N | -- | -- | |
| -- | $5,000 | -- | |
| -- | -- | -- |
Source: Public Records
Mortgage History
| Date | Status | Borrower | Loan Amount |
|---|---|---|---|
| Previous Owner | Not Available | $27,000 |
Source: Public Records
Tax History
| Year | Tax Paid | Tax Assessment Tax Assessment Total Assessment is a certain percentage of the fair market value that is determined by local assessors to be the total taxable value of land and additions on the property. | Land | Improvement |
|---|---|---|---|---|
| 2025 | $217 | $11,575 | $1,250 | $10,325 |
| 2024 | $217 | $11,575 | $1,250 | $10,325 |
| 2022 | $404 | $11,575 | $1,250 | $10,325 |
| 2021 | $350 | $8,125 | $1,100 | $7,025 |
| 2020 | $350 | $8,125 | $1,100 | $7,025 |
| 2019 | $350 | $8,125 | $1,100 | $7,025 |
| 2018 | $275 | $6,375 | $1,100 | $5,275 |
| 2017 | $191 | $4,325 | $1,100 | $3,225 |
| 2016 | $178 | $4,325 | $1,100 | $3,225 |
| 2015 | $178 | $4,325 | $1,100 | $3,225 |
| 2014 | $178 | $4,325 | $1,100 | $3,225 |
Source: Public Records
Map
Nearby Homes
Your Personal Tour Guide
Ask me questions while you tour the home.