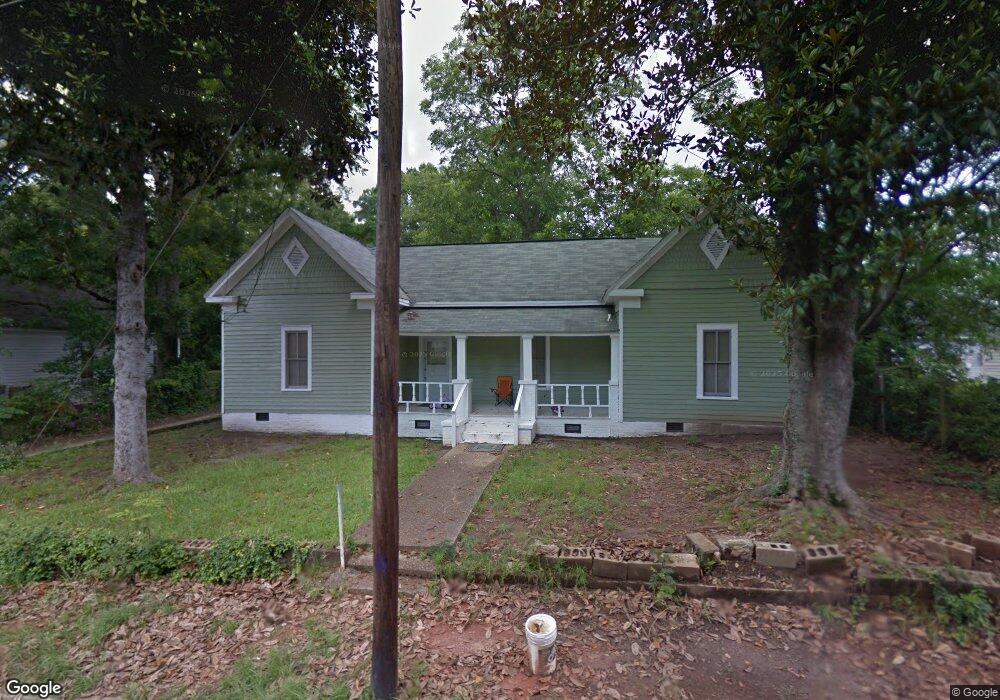
402 Dixie St Lagrange, GA 30241
Estimated Value: $77,000 - $106,174
3
Beds
1
Bath
1,624
Sq Ft
$58/Sq Ft
Est. Value
About This Home
This home is located at 402 Dixie St, Lagrange, GA 30241 and is currently estimated at $94,794, approximately $58 per square foot. 402 Dixie St is a home located in Troup County with nearby schools including Franklin Forest Elementary School, Hollis Hand Elementary School, and Ethel W. Kight Elementary School.
Ownership History
Date
Name
Owned For
Owner Type
Purchase Details
Closed on
Feb 23, 2012
Sold by
Kinney David
Bought by
Phillips Dwight
Current Estimated Value
Purchase Details
Closed on
Nov 5, 2005
Sold by
Arrington James R
Bought by
Kinney David
Purchase Details
Closed on
Sep 26, 1995
Sold by
Walter Davis
Bought by
James R Arrington
Purchase Details
Closed on
Oct 13, 1989
Sold by
Sara A Graham
Bought by
Walter Davis
Purchase Details
Closed on
Dec 1, 1987
Bought by
Sara A Graham
Purchase Details
Closed on
Sep 6, 1985
Purchase Details
Closed on
May 22, 1979
Sold by
James A Wood
Purchase Details
Closed on
Sep 22, 1975
Bought by
James A Wood
Purchase Details
Closed on
Jan 1, 1973
Purchase Details
Closed on
Jan 1, 1968
Create a Home Valuation Report for This Property
The Home Valuation Report is an in-depth analysis detailing your home's value as well as a comparison with similar homes in the area
Purchase History
| Date | Buyer | Sale Price | Title Company |
|---|---|---|---|
| Phillips Dwight | $33,000 | -- | |
| Kinney David | -- | -- | |
| James R Arrington | $16,000 | -- | |
| Walter Davis | -- | -- | |
| Sara A Graham | -- | -- | |
| -- | $100 | -- | |
| -- | $100 | -- | |
| -- | -- | -- | |
| James A Wood | -- | -- | |
| -- | -- | -- | |
| -- | -- | -- |
Source: Public Records
Tax History
| Year | Tax Paid | Tax Assessment Tax Assessment Total Assessment is a certain percentage of the fair market value that is determined by local assessors to be the total taxable value of land and additions on the property. | Land | Improvement |
|---|---|---|---|---|
| 2025 | $1,083 | $39,720 | $3,960 | $35,760 |
| 2024 | $959 | $35,160 | $3,960 | $31,200 |
| 2023 | $756 | $27,720 | $3,960 | $23,760 |
| 2022 | $732 | $26,240 | $3,960 | $22,280 |
| 2021 | $826 | $27,400 | $3,960 | $23,440 |
| 2020 | $826 | $27,400 | $3,960 | $23,440 |
| 2019 | $621 | $20,600 | $3,960 | $16,640 |
| 2018 | $602 | $19,960 | $3,320 | $16,640 |
| 2017 | $602 | $19,960 | $3,320 | $16,640 |
| 2016 | $596 | $19,754 | $3,320 | $16,434 |
| 2015 | $617 | $20,418 | $3,984 | $16,434 |
| 2014 | $592 | $19,553 | $3,984 | $15,569 |
| 2013 | -- | $20,922 | $3,984 | $16,939 |
Source: Public Records
Map
Nearby Homes
- 201 de Groat St
- 203 de Groat St
- 404 Dixie St
- 405 Dixie St
- 205 de Groat St
- 205 de Groat St
- 0 Dixie St Unit 8669672
- 207 de Groat St
- 700 de Groat St
- 702 de Groat St
- 411 Dixie St
- 407 Dixie St
- 704 de Groat St
- 209 de Groat St
- 620 de Groat St
- 618 de Groat St
- 706 de Groat St
- 119 de Groat St
- 100 de Groat Aly
- 701 Chattahoochee St
Your Personal Tour Guide
Ask me questions while you tour the home.