Estimated Value: $536,671 - $659,000
4
Beds
2
Baths
1,830
Sq Ft
$311/Sq Ft
Est. Value
About This Home
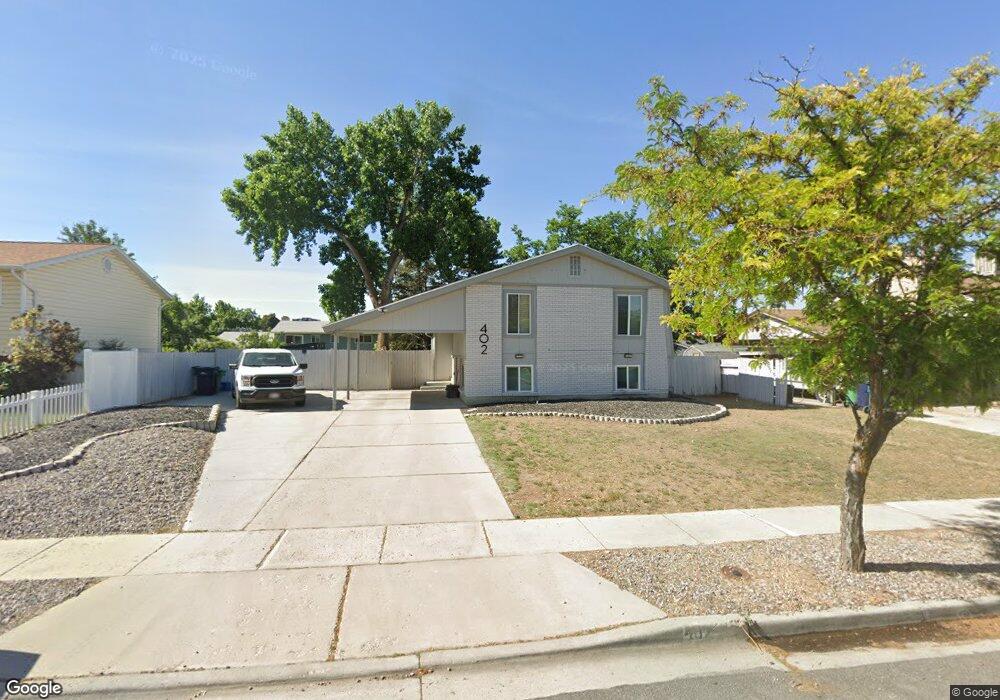
This home is located at 402 E 10185 S, Sandy, UT 84070 and is currently estimated at $568,418, approximately $310 per square foot. 402 E 10185 S is a home located in Salt Lake County with nearby schools including Alta View Elementary School, Jordan High, and Mount Jordan Middle School.
Ownership History
Date
Name
Owned For
Owner Type
Purchase Details
Closed on
Nov 9, 2021
Sold by
Gilchrist Jennifer and Gilchrist Jon
Bought by
Connelly Cameron
Current Estimated Value
Home Financials for this Owner
Home Financials are based on the most recent Mortgage that was taken out on this home.
Original Mortgage
$465,500
Outstanding Balance
$426,669
Interest Rate
3.01%
Mortgage Type
New Conventional
Estimated Equity
$141,749
Purchase Details
Closed on
May 26, 2021
Sold by
Radcliffe Ventures Llc
Bought by
Gilchrist Jennifer and Gilchrist Jon
Purchase Details
Closed on
Nov 19, 2020
Sold by
C R Radcliffe Investments Llc
Bought by
Radcliffe Ventures Llc
Purchase Details
Closed on
Oct 12, 2004
Sold by
Radcliffe Charles R
Bought by
C R Radcliffe Investments Llc
Purchase Details
Closed on
Jul 23, 1997
Sold by
Mcdonald Robert B and Mcdonald Debra L
Bought by
Radcliffe Charles R
Create a Home Valuation Report for This Property
The Home Valuation Report is an in-depth analysis detailing your home's value as well as a comparison with similar homes in the area
Home Values in the Area
Average Home Value in this Area
Purchase History
| Date | Buyer | Sale Price | Title Company |
|---|---|---|---|
| Connelly Cameron | -- | Sutherland Title | |
| Gilchrist Jennifer | -- | Vanguard Title Union Park | |
| Radcliffe Ventures Llc | -- | National Ttl Agcy Of Ut Inc | |
| C R Radcliffe Investments Llc | -- | -- | |
| Radcliffe Charles R | -- | First American Title |
Source: Public Records
Mortgage History
| Date | Status | Borrower | Loan Amount |
|---|---|---|---|
| Open | Connelly Cameron | $465,500 |
Source: Public Records
Tax History
| Year | Tax Paid | Tax Assessment Tax Assessment Total Assessment is a certain percentage of the fair market value that is determined by local assessors to be the total taxable value of land and additions on the property. | Land | Improvement |
|---|---|---|---|---|
| 2025 | $2,608 | $517,400 | $125,400 | $392,000 |
| 2024 | $2,608 | $493,100 | $119,700 | $373,400 |
| 2023 | $2,421 | $457,400 | $113,800 | $343,600 |
| 2022 | $2,528 | $466,900 | $111,600 | $355,300 |
| 2021 | $1,862 | $292,900 | $86,300 | $206,600 |
| 2020 | $2,127 | $264,200 | $86,300 | $177,900 |
| 2019 | $2,080 | $251,000 | $81,500 | $169,500 |
| 2016 | $1,693 | $209,400 | $81,500 | $127,900 |
Source: Public Records
Map
Nearby Homes
- 409 E 10185 S
- 586 E 10345 S
- 569 E Aloha Ln
- 574 E 10425 S
- 262 E Sandy Sage Way
- 375 E 10560 S
- 10556 S Sandy Sage Way
- 601 E Pali St
- 9822 S Darin Dr
- 717 Sand Dollar Dr
- 10351 S Zinnia Way
- 10564 S Weeping Willow Dr
- 8475 S State St
- 845 Larkspur Dr
- 10491 Amaryllis St
- 10522 Amaryllis St
- 101 E Rembrandt Cir
- 10510 S State St
- 837 E 10515 S
- 77 W Evening Star Way
Your Personal Tour Guide
Ask me questions while you tour the home.