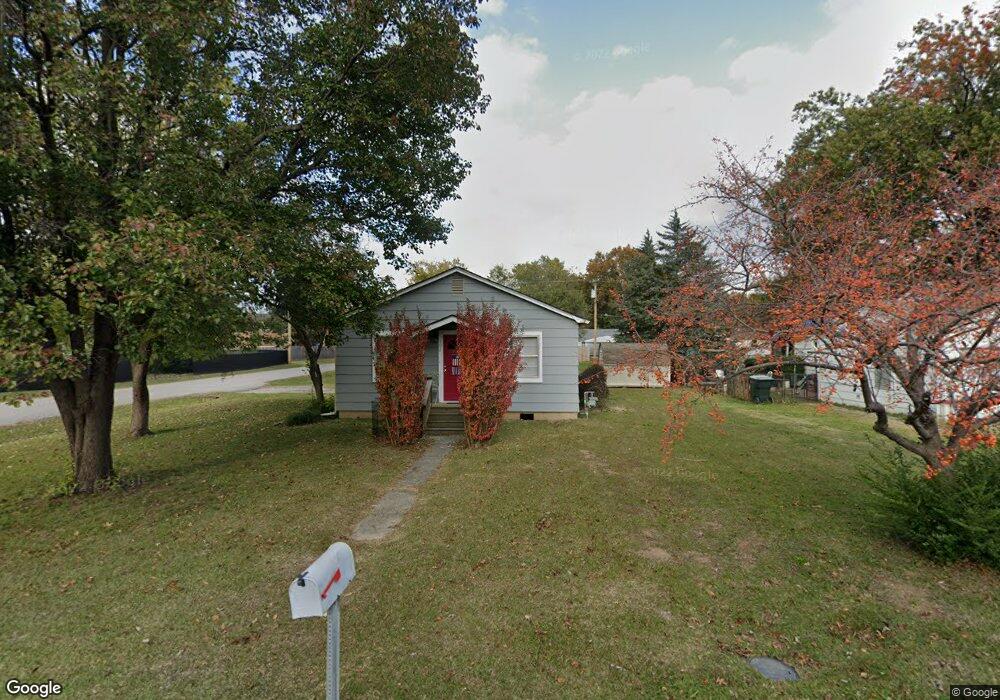
402 E 10th St Claremore, OK 74017
Estimated Value: $80,000 - $132,000
2
Beds
1
Bath
720
Sq Ft
$154/Sq Ft
Est. Value
About This Home
This home is located at 402 E 10th St, Claremore, OK 74017 and is currently estimated at $110,698, approximately $153 per square foot. 402 E 10th St is a home located in Rogers County with nearby schools including Claremont Elementary School, Will Rogers Junior High School, and Claremore High School.
Ownership History
Date
Name
Owned For
Owner Type
Purchase Details
Closed on
Jul 12, 2021
Sold by
Tandy Sue A
Bought by
Tandy Scott Bell and Tandy Crystal Kay
Current Estimated Value
Home Financials for this Owner
Home Financials are based on the most recent Mortgage that was taken out on this home.
Original Mortgage
$45,000
Outstanding Balance
$30,401
Interest Rate
2.9%
Mortgage Type
Commercial
Estimated Equity
$80,297
Purchase Details
Closed on
Oct 16, 2012
Sold by
Prelesnick Tony D and Prelesnick Jodi L
Bought by
Tandy Terry F and Tandy Sue A
Purchase Details
Closed on
Jun 23, 2009
Sold by
Huckleberry Dica G
Bought by
Prelesnick Jodi L and Prelesnick Tony D
Home Financials for this Owner
Home Financials are based on the most recent Mortgage that was taken out on this home.
Original Mortgage
$45,600
Interest Rate
4.83%
Mortgage Type
New Conventional
Purchase Details
Closed on
Jun 9, 2003
Sold by
Craig Leigh Ann
Purchase Details
Closed on
May 1, 2000
Sold by
Kirkland R D
Create a Home Valuation Report for This Property
The Home Valuation Report is an in-depth analysis detailing your home's value as well as a comparison with similar homes in the area
Home Values in the Area
Average Home Value in this Area
Purchase History
| Date | Buyer | Sale Price | Title Company |
|---|---|---|---|
| Tandy Scott Bell | $65,000 | Rogers County Abstract Co | |
| Tandy Terry F | $55,000 | None Available | |
| Prelesnick Jodi L | $57,000 | Land Title Closing Services | |
| -- | $51,000 | -- | |
| -- | $45,000 | -- |
Source: Public Records
Mortgage History
| Date | Status | Borrower | Loan Amount |
|---|---|---|---|
| Open | Tandy Scott Bell | $45,000 | |
| Previous Owner | Prelesnick Jodi L | $45,600 |
Source: Public Records
Tax History
| Year | Tax Paid | Tax Assessment Tax Assessment Total Assessment is a certain percentage of the fair market value that is determined by local assessors to be the total taxable value of land and additions on the property. | Land | Improvement |
|---|---|---|---|---|
| 2025 | $656 | $7,092 | $3,315 | $3,777 |
| 2024 | $624 | $6,755 | $2,271 | $4,484 |
| 2023 | $624 | $7,099 | $2,174 | $4,925 |
| 2022 | $665 | $7,179 | $2,174 | $5,005 |
| 2021 | $610 | $6,934 | $2,174 | $4,760 |
| 2020 | $603 | $6,581 | $1,910 | $4,671 |
| 2019 | $611 | $6,599 | $1,910 | $4,689 |
| 2018 | $635 | $6,874 | $1,910 | $4,964 |
| 2017 | $627 | $6,826 | $1,910 | $4,916 |
| 2016 | $626 | $6,673 | $1,910 | $4,763 |
| 2015 | $594 | $6,409 | $1,910 | $4,499 |
| 2014 | $598 | $6,452 | $1,910 | $4,542 |
Source: Public Records
Map
Nearby Homes
- 607 E 11th St
- 601 E 11th St
- 402 E 6th St
- 1114 N Osage Ave
- 403 N Choctaw Ave
- 817 E 11th St
- 821 E 11th St
- 520 E 6th St
- 104 W 7th St
- 1317 N Mcfarland Place
- 110 E 13th Place
- 509 N Weenonah Ave
- 704 N Sioux Ave
- 125 E Powell St
- 1335 N Mcfarland Place
- 1137 N Oklahoma Ave
- 2925 E Holly Rd
- 614 E 5th St
- 314 W 7th St
- 221 N Dorothy Ave
Your Personal Tour Guide
Ask me questions while you tour the home.