Estimated Value: $516,395 - $666,000
Studio
1
Bath
2,338
Sq Ft
$253/Sq Ft
Est. Value
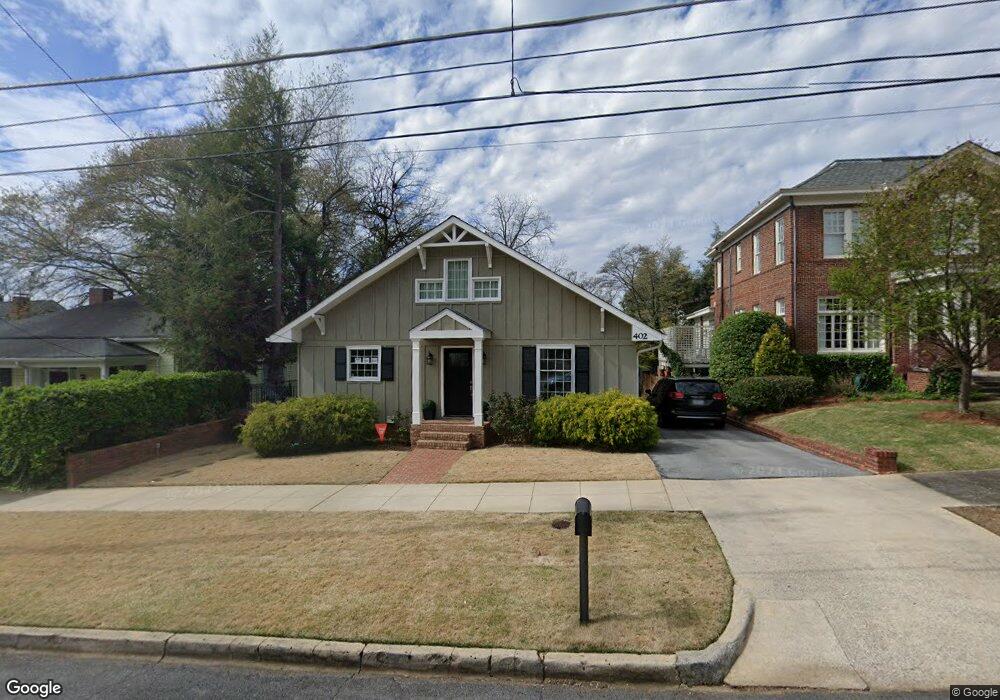
About This Home
This home is located at 402 E 3rd Ave, Rome, GA 30161 and is currently estimated at $592,465, approximately $253 per square foot. 402 E 3rd Ave is a home located in Floyd County with nearby schools including Rome High School, St. Mary School, and Darlington School.
Ownership History
Date
Name
Owned For
Owner Type
Purchase Details
Closed on
Apr 21, 2016
Sold by
York Richard A
Bought by
Holmes Joseph C and Holmes Leigh B
Current Estimated Value
Home Financials for this Owner
Home Financials are based on the most recent Mortgage that was taken out on this home.
Original Mortgage
$224,000
Outstanding Balance
$176,680
Interest Rate
3.71%
Mortgage Type
New Conventional
Estimated Equity
$415,785
Purchase Details
Closed on
May 15, 2013
Sold by
York Richard A
Bought by
York Richard A
Purchase Details
Closed on
Dec 4, 1992
Sold by
Harbin Lester B and Buford Goodwin Harb
Bought by
York Richard A and York Elizabeth M
Purchase Details
Closed on
Aug 13, 1992
Sold by
Brock Roy Crawford
Bought by
Harbin Lester B and Buford Goodwin
Purchase Details
Closed on
Jan 10, 1991
Sold by
Bennett Thomas C
Bought by
Brock Roy Crawford
Purchase Details
Closed on
Jun 12, 1969
Sold by
Cone Bessie C
Bought by
Sullivan Mary Lee
Purchase Details
Closed on
Jan 1, 1901
Bought by
Cone Bessie C
Create a Home Valuation Report for This Property
The Home Valuation Report is an in-depth analysis detailing your home's value as well as a comparison with similar homes in the area
Home Values in the Area
Average Home Value in this Area
Purchase History
| Date | Buyer | Sale Price | Title Company |
|---|---|---|---|
| Holmes Joseph C | $295,000 | -- | |
| York Richard A | -- | -- | |
| York Richard A | $145,000 | -- | |
| Harbin Lester B | $130,000 | -- | |
| Brock Roy Crawford | $143,800 | -- | |
| Bennett Thomas C | $135,000 | -- | |
| Sullivan Mary Lee | $13,000 | -- | |
| Cone Bessie C | -- | -- |
Source: Public Records
Mortgage History
| Date | Status | Borrower | Loan Amount |
|---|---|---|---|
| Open | Holmes Joseph C | $224,000 |
Source: Public Records
Tax History
| Year | Tax Paid | Tax Assessment Tax Assessment Total Assessment is a certain percentage of the fair market value that is determined by local assessors to be the total taxable value of land and additions on the property. | Land | Improvement |
|---|---|---|---|---|
| 2025 | $7,628 | $213,375 | $15,924 | $197,451 |
| 2024 | $7,628 | $200,050 | $14,476 | $185,574 |
| 2023 | $7,085 | $193,797 | $13,028 | $180,769 |
| 2022 | $5,949 | $163,034 | $10,754 | $152,280 |
| 2021 | $5,556 | $149,725 | $10,754 | $138,971 |
| 2020 | $5,289 | $141,360 | $8,272 | $133,088 |
| 2019 | $4,497 | $121,481 | $8,272 | $113,209 |
| 2018 | $4,497 | $121,481 | $8,272 | $113,209 |
| 2017 | $3,959 | $125,813 | $8,272 | $117,541 |
| 2016 | $1,991 | $83,080 | $8,240 | $74,840 |
| 2015 | $1,682 | $84,400 | $8,240 | $76,160 |
| 2014 | $1,682 | $73,484 | $6,200 | $67,284 |
Source: Public Records
Map
Nearby Homes
- 320 E 3rd Ave
- 214 E 3rd St
- 312 E 3rd St
- 202 E 4th Ave Unit 5
- 29 Pear St
- 407 E 3rd St
- 204 E 5th Ave
- 501 E 3rd St
- 10 E 3rd Ave
- 8 E 3rd Ave
- 1 E 3rd Ave Unit 302
- 2 Coral Ave SW
- 633 E 3rd St
- 0 Brook Valley Ct Unit 10665224
- 0 Brook Valley Ct Unit 7698646
- 138 E 8th Ave Unit 25
- 801 Maple Ave SW
- 167 Sweet Water Ln
- 232 S Broad St SW
- 311 Roswell Ave SE
Your Personal Tour Guide
Ask me questions while you tour the home.