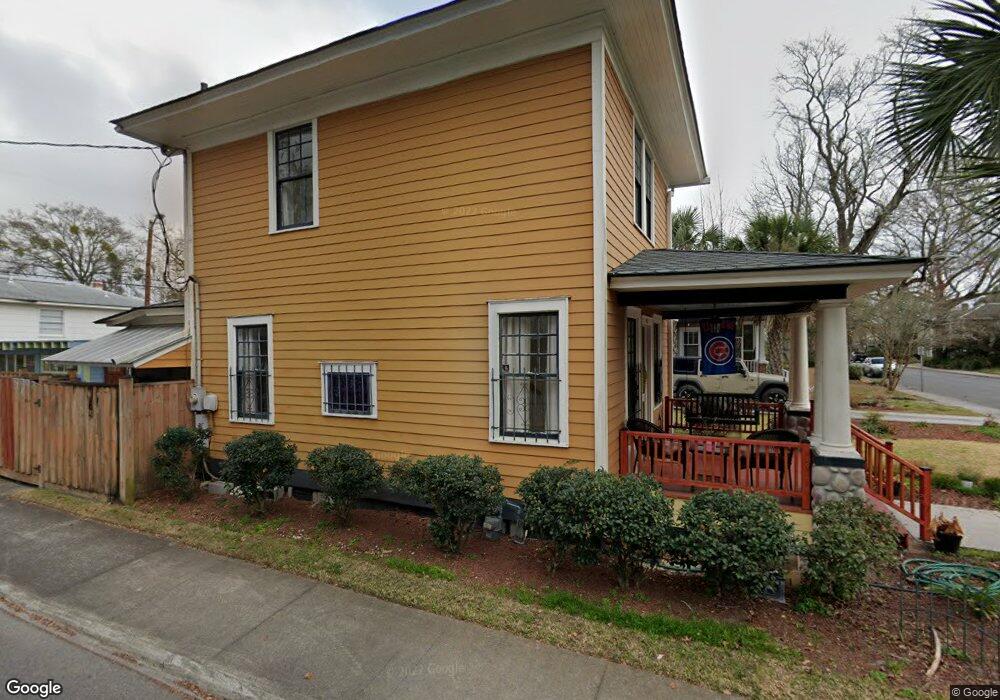
402 E 49th St Savannah, GA 31405
Ardsley Park-Chatham Crescent NeighborhoodEstimated Value: $398,000 - $500,000
3
Beds
2
Baths
1,149
Sq Ft
$385/Sq Ft
Est. Value
About This Home
This home is located at 402 E 49th St, Savannah, GA 31405 and is currently estimated at $442,818, approximately $385 per square foot. 402 E 49th St is a home located in Chatham County with nearby schools including Jacob G. Smith Elementary School, Myers Middle School, and Beach High School.
Ownership History
Date
Name
Owned For
Owner Type
Purchase Details
Closed on
Sep 6, 2024
Sold by
Gunsallus Lora
Bought by
Gunsallus Lora and Mcdaniel Kelly A
Current Estimated Value
Purchase Details
Closed on
Jul 31, 2008
Sold by
Not Provided
Bought by
Gunsallus Lora
Home Financials for this Owner
Home Financials are based on the most recent Mortgage that was taken out on this home.
Original Mortgage
$265,173
Interest Rate
6.31%
Mortgage Type
FHA
Purchase Details
Closed on
Jan 14, 2005
Sold by
Hall Richard W
Bought by
Hall Marguerite Ellis
Create a Home Valuation Report for This Property
The Home Valuation Report is an in-depth analysis detailing your home's value as well as a comparison with similar homes in the area
Home Values in the Area
Average Home Value in this Area
Purchase History
| Date | Buyer | Sale Price | Title Company |
|---|---|---|---|
| Gunsallus Lora | -- | -- | |
| Gunsallus Lora | $270,000 | -- | |
| Hall Marguerite Ellis | -- | -- |
Source: Public Records
Mortgage History
| Date | Status | Borrower | Loan Amount |
|---|---|---|---|
| Previous Owner | Gunsallus Lora | $265,173 |
Source: Public Records
Tax History
| Year | Tax Paid | Tax Assessment Tax Assessment Total Assessment is a certain percentage of the fair market value that is determined by local assessors to be the total taxable value of land and additions on the property. | Land | Improvement |
|---|---|---|---|---|
| 2025 | $2,640 | $126,600 | $44,000 | $82,600 |
| 2024 | $18 | $120,000 | $44,000 | $76,000 |
| 2023 | $936 | $94,760 | $30,000 | $64,760 |
| 2022 | $2,033 | $88,280 | $30,000 | $58,280 |
| 2021 | $2,932 | $72,400 | $20,000 | $52,400 |
| 2020 | $2,025 | $72,040 | $20,000 | $52,040 |
| 2019 | $2,927 | $70,160 | $20,000 | $50,160 |
| 2018 | $1,865 | $65,080 | $20,000 | $45,080 |
| 2017 | $1,880 | $70,440 | $26,160 | $44,280 |
| 2016 | $1,784 | $67,440 | $26,160 | $41,280 |
| 2015 | $2,684 | $68,760 | $26,160 | $42,600 |
| 2014 | $3,776 | $73,760 | $0 | $0 |
Source: Public Records
Map
Nearby Homes
Your Personal Tour Guide
Ask me questions while you tour the home.