Estimated Value: $208,000 - $241,000
3
Beds
2
Baths
1,367
Sq Ft
$165/Sq Ft
Est. Value
About This Home
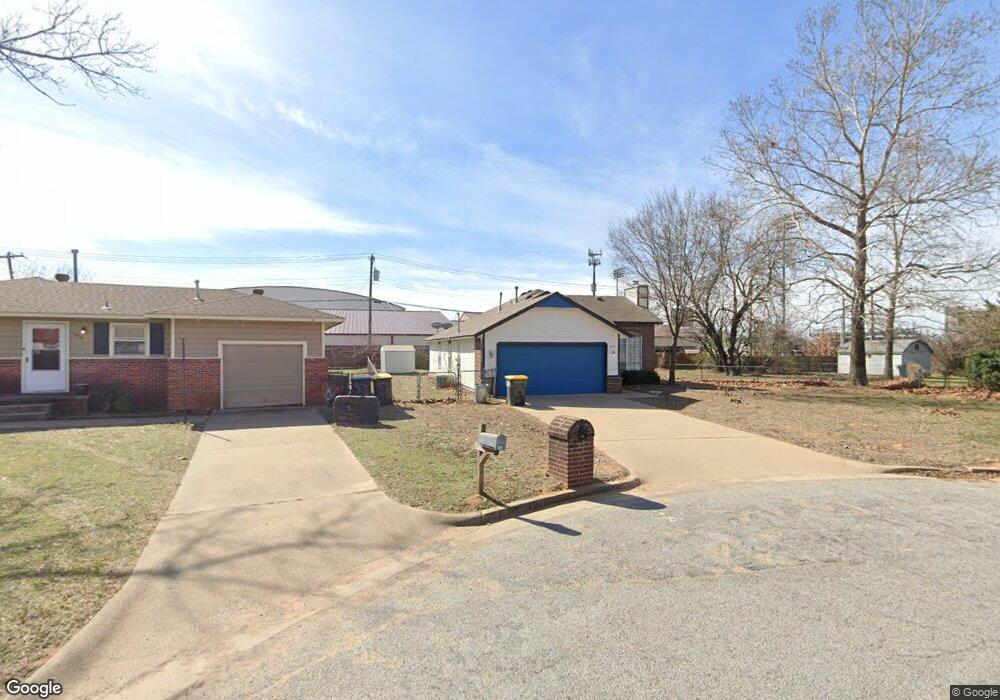
This home is located at 402 E D St, Jenks, OK 74037 and is currently estimated at $225,876, approximately $165 per square foot. 402 E D St is a home located in Tulsa County with nearby schools including Jenks West Elementary School, Jenks Middle School, and Jenks West Intermediate Elementary School.
Ownership History
Date
Name
Owned For
Owner Type
Purchase Details
Closed on
Dec 12, 2008
Sold by
Judkins Timothy L and Judkins Angela
Bought by
Winters Anthony J and Winters Codi
Current Estimated Value
Home Financials for this Owner
Home Financials are based on the most recent Mortgage that was taken out on this home.
Original Mortgage
$72,640
Outstanding Balance
$47,744
Interest Rate
6.19%
Mortgage Type
New Conventional
Estimated Equity
$178,132
Purchase Details
Closed on
Mar 29, 2001
Sold by
Gillay David R and Gillay Terri C
Bought by
Judkins Timothy L
Purchase Details
Closed on
Oct 31, 1997
Sold by
Southwind Homes Inc
Bought by
Gillay David R and Gillay Terri C
Home Financials for this Owner
Home Financials are based on the most recent Mortgage that was taken out on this home.
Original Mortgage
$75,858
Interest Rate
7.33%
Mortgage Type
FHA
Purchase Details
Closed on
Jul 21, 1997
Sold by
Southwind Homes Inc
Bought by
Largent Sharon L
Create a Home Valuation Report for This Property
The Home Valuation Report is an in-depth analysis detailing your home's value as well as a comparison with similar homes in the area
Home Values in the Area
Average Home Value in this Area
Purchase History
| Date | Buyer | Sale Price | Title Company |
|---|---|---|---|
| Winters Anthony J | $91,000 | Tulsa Abstract & Title Co | |
| Judkins Timothy L | $93,000 | Delta Title & Escrow Company | |
| Gillay David R | $77,000 | -- | |
| Southwind Homes Inc | -- | -- | |
| Largent Sharon L | $10,000 | -- |
Source: Public Records
Mortgage History
| Date | Status | Borrower | Loan Amount |
|---|---|---|---|
| Open | Winters Anthony J | $72,640 | |
| Previous Owner | Gillay David R | $75,858 |
Source: Public Records
Tax History
| Year | Tax Paid | Tax Assessment Tax Assessment Total Assessment is a certain percentage of the fair market value that is determined by local assessors to be the total taxable value of land and additions on the property. | Land | Improvement |
|---|---|---|---|---|
| 2025 | $2,169 | $17,289 | $2,177 | $15,112 |
| 2024 | $1,997 | $16,466 | $2,334 | $14,132 |
| 2023 | $1,997 | $15,682 | $2,098 | $13,584 |
| 2022 | $1,920 | $14,935 | $3,093 | $11,842 |
| 2021 | $1,852 | $14,224 | $2,946 | $11,278 |
| 2020 | $1,768 | $13,883 | $2,875 | $11,008 |
| 2019 | $1,695 | $13,222 | $2,738 | $10,484 |
| 2018 | $1,626 | $12,593 | $2,354 | $10,239 |
| 2017 | $1,553 | $12,232 | $2,287 | $9,945 |
| 2016 | $1,516 | $11,649 | $2,255 | $9,394 |
| 2015 | $1,544 | $11,649 | $2,255 | $9,394 |
| 2014 | $1,579 | $11,649 | $2,255 | $9,394 |
Source: Public Records
Map
Nearby Homes
- 405 E D St
- 408 E E St
- 504 E B St Unit 2102
- 504 E B St Unit 2101
- 504 E B St Unit 1103
- 504 E B St Unit 1104
- 204 E J St
- 1010 N 3rd St
- 513 W C St
- 718 E Beaver St
- 412 E Duncan St
- 321 W J St
- 407 N Forest St
- 549 N Elm St Unit H
- 0 Aquarium Dr
- 422 N Forest St
- 649 W 101st Place S
- 508 N Juniper St
- 1123 W F St
- 9031 S Delaware Ave Unit 703
Your Personal Tour Guide
Ask me questions while you tour the home.