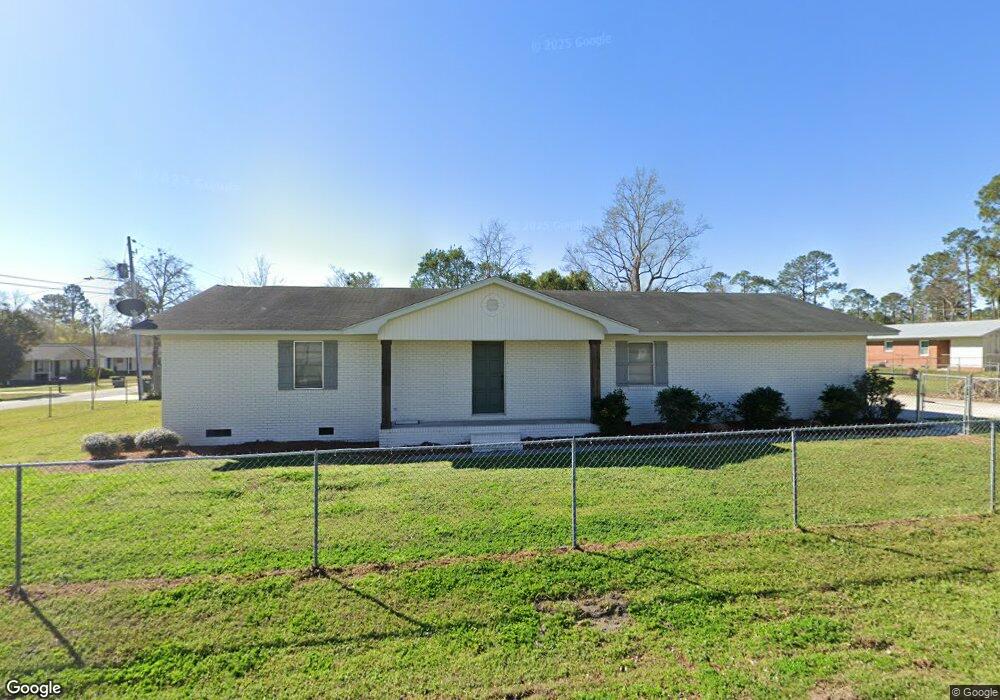
402 E Grace St Hahira, GA 31632
Estimated Value: $200,273 - $240,000
3
Beds
2
Baths
1,536
Sq Ft
$146/Sq Ft
Est. Value
About This Home
This home is located at 402 E Grace St, Hahira, GA 31632 and is currently estimated at $223,568, approximately $145 per square foot. 402 E Grace St is a home located in Lowndes County with nearby schools including Hahira Elementary School, Hahira Middle School, and Lowndes High School.
Ownership History
Date
Name
Owned For
Owner Type
Purchase Details
Closed on
Jun 16, 2021
Sold by
Redding Kimberly
Bought by
S & F Sycamore Properties Llc
Current Estimated Value
Home Financials for this Owner
Home Financials are based on the most recent Mortgage that was taken out on this home.
Original Mortgage
$85,600
Outstanding Balance
$71,311
Interest Rate
2.9%
Mortgage Type
New Conventional
Estimated Equity
$152,257
Purchase Details
Closed on
Dec 20, 2018
Sold by
Martin Henry Kevin
Bought by
Redding Kimberly and Redding Art
Home Financials for this Owner
Home Financials are based on the most recent Mortgage that was taken out on this home.
Original Mortgage
$54,994
Interest Rate
4.8%
Mortgage Type
New Conventional
Purchase Details
Closed on
Jul 17, 2018
Sold by
Martin Robert Henry
Bought by
Martin Henry Kevin and Martin Dorothy Faye Eta
Purchase Details
Closed on
Oct 24, 1978
Bought by
Martin Robert H
Create a Home Valuation Report for This Property
The Home Valuation Report is an in-depth analysis detailing your home's value as well as a comparison with similar homes in the area
Home Values in the Area
Average Home Value in this Area
Purchase History
| Date | Buyer | Sale Price | Title Company |
|---|---|---|---|
| S & F Sycamore Properties Llc | $115,000 | -- | |
| Redding Kimberly | $67,500 | -- | |
| Martin Henry Kevin | -- | -- | |
| Martin Robert H | $42,500 | -- |
Source: Public Records
Mortgage History
| Date | Status | Borrower | Loan Amount |
|---|---|---|---|
| Open | S & F Sycamore Properties Llc | $85,600 | |
| Previous Owner | Redding Kimberly | $54,994 |
Source: Public Records
Tax History Compared to Growth
Tax History
| Year | Tax Paid | Tax Assessment Tax Assessment Total Assessment is a certain percentage of the fair market value that is determined by local assessors to be the total taxable value of land and additions on the property. | Land | Improvement |
|---|---|---|---|---|
| 2024 | $2,086 | $74,965 | $15,400 | $59,565 |
| 2023 | $1,973 | $46,336 | $9,500 | $36,836 |
| 2022 | $1,432 | $45,986 | $9,500 | $36,486 |
| 2021 | $1,442 | $45,986 | $9,500 | $36,486 |
| 2020 | $1,138 | $35,790 | $9,500 | $26,290 |
| 2019 | $1,148 | $35,790 | $9,500 | $26,290 |
| 2018 | $882 | $35,790 | $9,500 | $26,290 |
| 2017 | $894 | $35,790 | $9,500 | $26,290 |
| 2016 | $826 | $33,669 | $9,500 | $24,169 |
| 2015 | -- | $33,669 | $9,500 | $24,169 |
| 2014 | -- | $33,669 | $9,500 | $24,169 |
Source: Public Records
Map
Nearby Homes
- 605 S Nelson St
- 601 Katherine Ln
- 627 Stagecoach Trail
- 0 E Stanfill St
- The Walker Plan at Reynolda Place
- The Belfort Plan at Reynolda Place
- The Ozark Plan at Reynolda Place
- The Beau Plan at Reynolda Place
- 1105 Hannah Dr
- 1109 Hannah Dr
- 411 Judy Ann Dr
- 1063 Angie Ln
- 601 E Stanfill St
- 209 N West St
- 3021 Mary Powell Way
- 334 Barry Field Cir
- 358 Barry Field Cir
- 221 Barry Field Cir
- 216 Barry Field Cir
- 359 Barry Field Cir
- 404 S College St
- 401 Weaver St
- 403 Weaver St
- 406 S College St
- 500 E Grace St
- 407 Weaver St
- 405 S College St
- 408 S College St
- 409 S College St
- 411 Weaver St
- 305 E Grace St
- 413 S College St
- 306 E Grace St
- 500 S College St
- 406 Weaver St
- 502 E Grace St
- 503 Weaver St
- 406 Lafayette St
- 408 Lafayette St
- 408 Weaver St