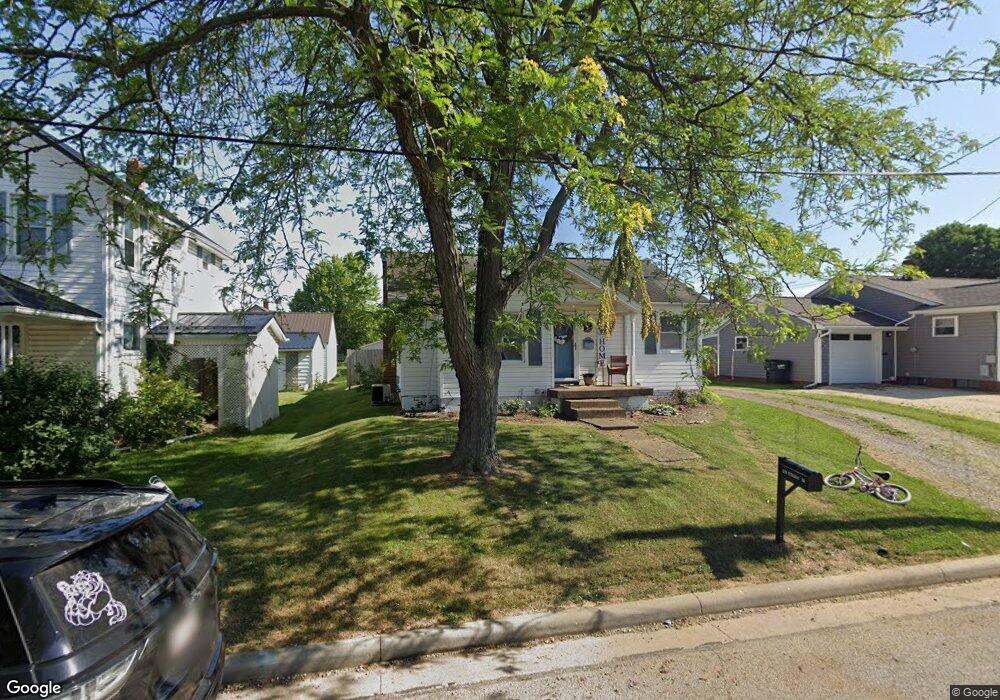
402 Jackson St Unit 25 Minerva, OH 44657
Estimated Value: $110,000 - $150,000
2
Beds
1
Bath
1,527
Sq Ft
$89/Sq Ft
Est. Value
About This Home
This home is located at 402 Jackson St Unit 25, Minerva, OH 44657 and is currently estimated at $136,024, approximately $89 per square foot. 402 Jackson St Unit 25 is a home located in Carroll County with nearby schools including Minerva Elementary School, Minerva Middle School, and Minerva High School.
Ownership History
Date
Name
Owned For
Owner Type
Purchase Details
Closed on
May 13, 2021
Sold by
Kachermeyer Shelley Lynne
Bought by
Smith Kristen L
Current Estimated Value
Home Financials for this Owner
Home Financials are based on the most recent Mortgage that was taken out on this home.
Original Mortgage
$92,625
Outstanding Balance
$83,941
Interest Rate
3.1%
Mortgage Type
New Conventional
Estimated Equity
$52,083
Create a Home Valuation Report for This Property
The Home Valuation Report is an in-depth analysis detailing your home's value as well as a comparison with similar homes in the area
Home Values in the Area
Average Home Value in this Area
Purchase History
| Date | Buyer | Sale Price | Title Company |
|---|---|---|---|
| Smith Kristen L | -- | None Available |
Source: Public Records
Mortgage History
| Date | Status | Borrower | Loan Amount |
|---|---|---|---|
| Open | Smith Kristen L | $92,625 |
Source: Public Records
Tax History
| Year | Tax Paid | Tax Assessment Tax Assessment Total Assessment is a certain percentage of the fair market value that is determined by local assessors to be the total taxable value of land and additions on the property. | Land | Improvement |
|---|---|---|---|---|
| 2024 | $1,578 | $37,710 | $4,610 | $33,100 |
| 2023 | $1,644 | $37,710 | $4,610 | $33,100 |
| 2022 | $1,644 | $28,780 | $3,820 | $24,960 |
| 2021 | $1,413 | $28,780 | $3,820 | $24,960 |
| 2020 | $1,331 | $28,780 | $3,820 | $24,960 |
| 2019 | $1,165 | $28,777 | $3,815 | $24,962 |
| 2018 | $978 | $22,410 | $3,570 | $18,840 |
| 2017 | $1,005 | $22,410 | $3,570 | $18,840 |
| 2016 | $954 | $20,560 | $3,270 | $17,290 |
| 2015 | $954 | $20,560 | $3,270 | $17,290 |
| 2014 | $980 | $20,560 | $3,270 | $17,290 |
| 2013 | $980 | $20,560 | $3,270 | $17,290 |
Source: Public Records
Map
Nearby Homes
- 404 Union Ave Unit 25
- 513 Queen St Unit 1A
- 701 E Lincolnway
- 0 Lynnwood Dr
- 806 S Grant Blvd
- 606 Murray Ave Unit 16
- 113 W 1st St
- 701 W Line St Unit 34
- 208 Ridgewood Blvd
- 144 W 1st St
- 605 Stadium St
- 0 Surrey Dr SE
- 22141 Mcdaniel St
- 1179 Alliance Rd NW Unit 11E
- 22657 Mayfair Ave
- 8087 Magnet Rd NE Unit 13E
- 9996 Stump Rd
- 10240 Manor Rd NE Unit 5
- 14000 Lincoln St SE Unit LOT A
- 14000 Lincoln St SE Unit 3
- 400 Jackson St Unit 25
- 404 Jackson St Unit 25
- 407 E Line St Unit 25
- 409 E Line St Unit 25
- 405 E Line St Unit 25
- 0 Jackson St Unit 4496434
- 316 Jackson St
- 408 Jackson St Unit 25
- 408 Jackson St
- 403 Jackson St Unit 25
- 401 Jackson St Unit 25
- 405 Jackson St Unit 25
- 326 Jackson St Unit 25
- 407 Jackson St Unit 25
- 411 E Line St Unit 25
- 329 E Line St Unit 25
- 325 Jackson St Unit 25
- 324 Jackson St Unit 25
- 409 Jackson St Unit 25
- 327 E Line St Unit 25
Your Personal Tour Guide
Ask me questions while you tour the home.