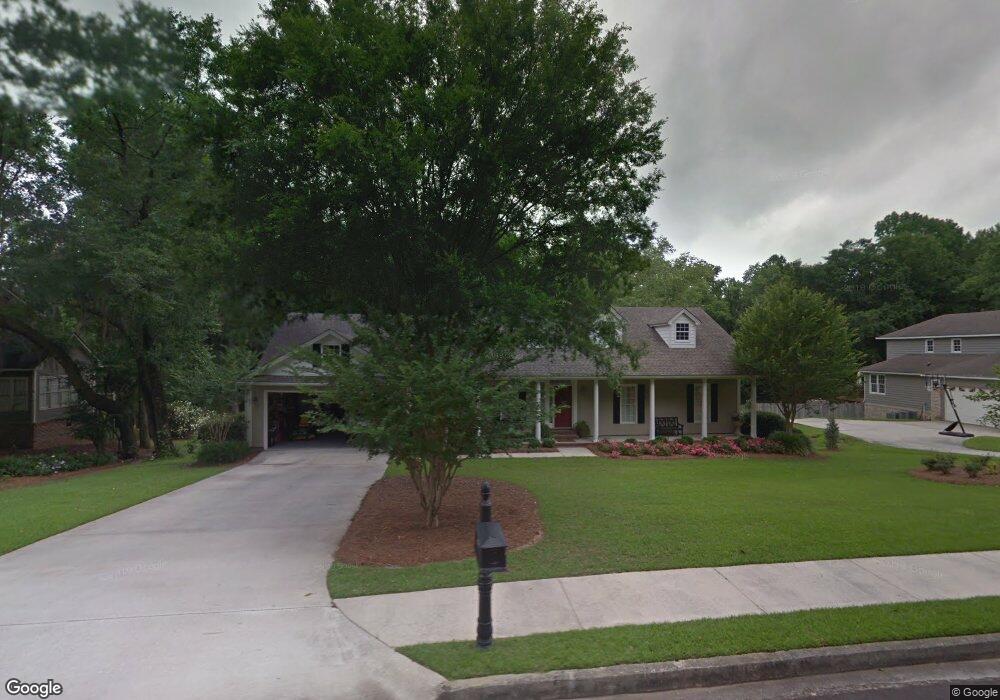
402 Knob Hill Rd Valdosta, GA 31602
Estimated Value: $315,854 - $462,000
4
Beds
3
Baths
2,400
Sq Ft
$168/Sq Ft
Est. Value
About This Home
This home is located at 402 Knob Hill Rd, Valdosta, GA 31602 and is currently estimated at $402,464, approximately $167 per square foot. 402 Knob Hill Rd is a home located in Lowndes County with nearby schools including S.L. Mason Elementary School, Valdosta Middle School, and Valdosta High School.
Ownership History
Date
Name
Owned For
Owner Type
Purchase Details
Closed on
Aug 14, 2015
Sold by
Walker Gary M
Bought by
Washock Mary Jane
Current Estimated Value
Purchase Details
Closed on
Jun 23, 2005
Sold by
Griner Brian C
Bought by
Walker Gary M and Walker Laura L
Home Financials for this Owner
Home Financials are based on the most recent Mortgage that was taken out on this home.
Original Mortgage
$205,200
Interest Rate
5.57%
Mortgage Type
New Conventional
Purchase Details
Closed on
Mar 16, 2005
Sold by
Griner Amy C
Bought by
Griner Brian C
Purchase Details
Closed on
Jun 15, 1999
Sold by
Johnson Loyd H Const
Bought by
Griner Brian C and Griner Amy C
Purchase Details
Closed on
Dec 28, 1995
Bought by
Johnson Loyd H Const
Purchase Details
Closed on
Aug 5, 1993
Bought by
Blanton Ben R
Purchase Details
Closed on
Jun 25, 1993
Bought by
Johnson Loyd H Construc
Purchase Details
Closed on
Nov 13, 1989
Bought by
Liberty Savings Bank Fsb
Create a Home Valuation Report for This Property
The Home Valuation Report is an in-depth analysis detailing your home's value as well as a comparison with similar homes in the area
Home Values in the Area
Average Home Value in this Area
Purchase History
| Date | Buyer | Sale Price | Title Company |
|---|---|---|---|
| Washock Mary Jane | $222,000 | -- | |
| Walker Gary M | $216,000 | -- | |
| Griner Brian C | -- | -- | |
| Griner Brian C | $215,000 | -- | |
| Johnson Loyd H Const | $31,000 | -- | |
| Blanton Ben R | $31,000 | -- | |
| Johnson Loyd H Construc | -- | -- | |
| Liberty Savings Bank Fsb | -- | -- |
Source: Public Records
Mortgage History
| Date | Status | Borrower | Loan Amount |
|---|---|---|---|
| Previous Owner | Walker Gary M | $205,200 |
Source: Public Records
Tax History Compared to Growth
Tax History
| Year | Tax Paid | Tax Assessment Tax Assessment Total Assessment is a certain percentage of the fair market value that is determined by local assessors to be the total taxable value of land and additions on the property. | Land | Improvement |
|---|---|---|---|---|
| 2024 | $2,495 | $99,346 | $18,000 | $81,346 |
| 2023 | $2,495 | $99,346 | $18,000 | $81,346 |
| 2022 | $2,555 | $85,596 | $18,000 | $67,596 |
| 2021 | $2,315 | $76,583 | $18,000 | $58,583 |
| 2020 | $2,365 | $76,583 | $18,000 | $58,583 |
| 2019 | $2,364 | $76,583 | $18,000 | $58,583 |
| 2018 | $2,115 | $68,828 | $18,000 | $50,828 |
| 2017 | $2,130 | $68,828 | $18,000 | $50,828 |
| 2016 | $2,127 | $68,828 | $18,000 | $50,828 |
| 2015 | $2,916 | $87,880 | $18,000 | $69,880 |
| 2014 | $2,965 | $87,880 | $18,000 | $69,880 |
Source: Public Records
Map
Nearby Homes
- 103 Knob Hill Rd
- 2909 Pebblewood Dr
- 2905 Pebblewood Dr
- 5 Post Pointe Cir
- 0 Us Highway 41
- 3219 Country Club Dr
- 2517 Rolling Rd
- 1113 Clover Hill Rd
- 2510 Winding Way
- 2608 Jerry Jones Dr
- 1100 Ravenwood Cir
- 7 Winding Cir
- 4 Charlcote Cir
- 3201 Ridgefield Ln
- 2524 Jerry Jones Dr
- 3336 Plantation Dr
- 1112 Lake Dr
- 1114 Lake Dr
- 2400 Winding Way
- 3737 Bermuda Run Dr
- 400 Knob Hill Rd
- 404 Knob Hill Rd
- 0 Knob Hill Rd
- 403 Knob Hill Rd
- 406 Knob Hill Rd
- 318 Knob Hill Rd
- 405 Knob Hill Rd
- 401 Knob Hill Rd
- 316 Knob Hill Rd
- 319 Knob Hill Rd
- 408 Knob Hill Rd
- 407 Knob Hill Rd
- 104 Knob Hill Rd
- 317 Knob Hill Rd
- 102 Knob Hill Rd
- 314 Knob Hill Rd
- 106 Knob Hill Rd
- 100 Knob Hill Rd
- 315 Knob Hill Rd
- 500 Knob Hill Rd