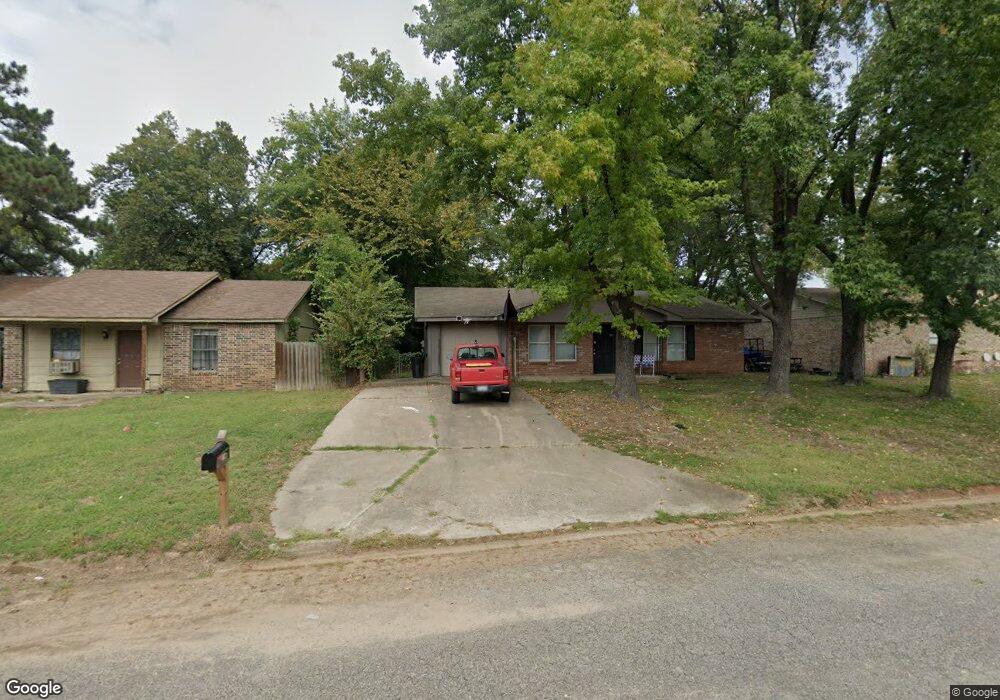
402 Loop W Roland, OK 74954
Estimated Value: $135,393 - $152,000
3
Beds
2
Baths
1,130
Sq Ft
$128/Sq Ft
Est. Value
About This Home
This home is located at 402 Loop W, Roland, OK 74954 and is currently estimated at $144,348, approximately $127 per square foot. 402 Loop W is a home located in Sequoyah County with nearby schools including Roland Middle School and Roland High School.
Ownership History
Date
Name
Owned For
Owner Type
Purchase Details
Closed on
Aug 7, 2014
Sold by
Cooper Sandra
Bought by
Sonoma Properties Llc
Current Estimated Value
Purchase Details
Closed on
Dec 30, 2013
Sold by
Strong Raymonde and Strong Rebecc
Bought by
Cooper Sandra
Purchase Details
Closed on
Feb 16, 2012
Sold by
Stormes Stacey S and Doe John
Bought by
Strong Raymond
Home Financials for this Owner
Home Financials are based on the most recent Mortgage that was taken out on this home.
Original Mortgage
$50,000
Interest Rate
6.25%
Mortgage Type
Future Advance Clause Open End Mortgage
Purchase Details
Closed on
Feb 15, 2012
Sold by
Strong Raymond and Strong Rebecca
Bought by
Strong Raymond and Cooper Sandra
Home Financials for this Owner
Home Financials are based on the most recent Mortgage that was taken out on this home.
Original Mortgage
$50,000
Interest Rate
6.25%
Mortgage Type
Future Advance Clause Open End Mortgage
Purchase Details
Closed on
Feb 11, 1992
Sold by
Mowdy Donald L
Bought by
Stormes Stacey
Create a Home Valuation Report for This Property
The Home Valuation Report is an in-depth analysis detailing your home's value as well as a comparison with similar homes in the area
Home Values in the Area
Average Home Value in this Area
Purchase History
| Date | Buyer | Sale Price | Title Company |
|---|---|---|---|
| Sonoma Properties Llc | $51,500 | -- | |
| Cooper Sandra | -- | -- | |
| Strong Raymond | -- | None Available | |
| Strong Raymond | -- | None Available | |
| Stormes Stacey | $42,500 | -- |
Source: Public Records
Mortgage History
| Date | Status | Borrower | Loan Amount |
|---|---|---|---|
| Previous Owner | Strong Raymond | $50,000 |
Source: Public Records
Tax History
| Year | Tax Paid | Tax Assessment Tax Assessment Total Assessment is a certain percentage of the fair market value that is determined by local assessors to be the total taxable value of land and additions on the property. | Land | Improvement |
|---|---|---|---|---|
| 2025 | $821 | $9,231 | $1,559 | $7,672 |
| 2024 | $821 | $8,792 | $1,485 | $7,307 |
| 2023 | $782 | $8,373 | $1,485 | $6,888 |
| 2022 | $703 | $7,974 | $1,485 | $6,489 |
| 2021 | $677 | $7,595 | $1,485 | $6,110 |
| 2020 | $658 | $7,230 | $1,485 | $5,745 |
| 2019 | $627 | $6,886 | $1,485 | $5,401 |
| 2018 | $549 | $6,558 | $1,485 | $5,073 |
| 2017 | $532 | $6,245 | $1,485 | $4,760 |
| 2016 | $500 | $5,948 | $1,485 | $4,463 |
| 2015 | $465 | $5,665 | $1,485 | $4,180 |
| 2014 | $451 | $5,481 | $725 | $4,756 |
Source: Public Records
Map
Nearby Homes
- 105 Circle b N
- 123 Gamma Cir
- 121 Saskatchewan Rd
- 106 Commanche Loop
- 102 Gamma Cir
- 101 Beta Cir
- 109 W Howard St
- 103 Mondier St
- 210 Roberts Loop
- 102 Mondier St
- 405 Woodland Hills Blvd
- 109 Claretta Dr
- 206 Roberts Loop
- 101 Lanita Dr
- Lot 1 N 4780 Rd
- 101 Hollow Dr
- 103 Granny St
- 116 Roland Estate Ln
- 101 Taylor Dr
- 138 Stone Dr
Your Personal Tour Guide
Ask me questions while you tour the home.