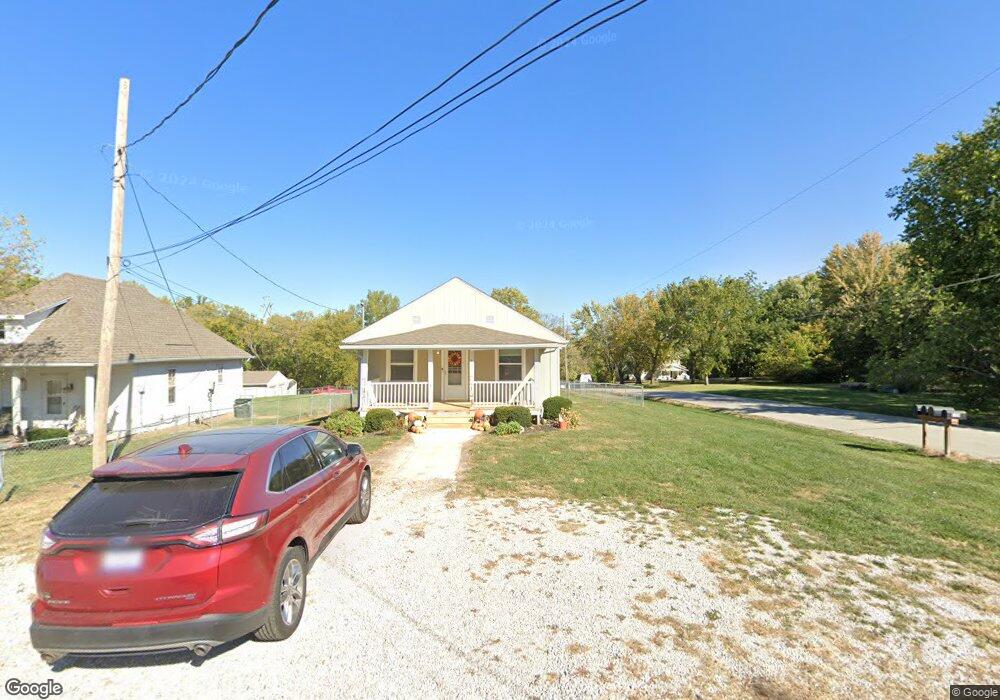
402 Main St Stilwell, KS 66085
Estimated Value: $186,872 - $309,000
2
Beds
1
Bath
894
Sq Ft
$278/Sq Ft
Est. Value
About This Home
This home is located at 402 Main St, Stilwell, KS 66085 and is currently estimated at $248,718, approximately $278 per square foot. 402 Main St is a home located in Johnson County with nearby schools including Stilwell Elementary School, Blue Valley Middle School, and Blue Valley High School.
Ownership History
Date
Name
Owned For
Owner Type
Purchase Details
Closed on
Dec 20, 2018
Sold by
Winston John L and Winston Teresa A
Bought by
Winston John L and Winston Teresa A
Current Estimated Value
Purchase Details
Closed on
Sep 5, 2007
Sold by
Chaney David M
Bought by
Winston John and Winston Teresa
Home Financials for this Owner
Home Financials are based on the most recent Mortgage that was taken out on this home.
Original Mortgage
$82,000
Outstanding Balance
$52,076
Interest Rate
6.63%
Mortgage Type
Future Advance Clause Open End Mortgage
Estimated Equity
$196,642
Purchase Details
Closed on
Sep 4, 2007
Sold by
Chaney Kathy A
Bought by
Chaney David M
Home Financials for this Owner
Home Financials are based on the most recent Mortgage that was taken out on this home.
Original Mortgage
$82,000
Outstanding Balance
$52,076
Interest Rate
6.63%
Mortgage Type
Future Advance Clause Open End Mortgage
Estimated Equity
$196,642
Create a Home Valuation Report for This Property
The Home Valuation Report is an in-depth analysis detailing your home's value as well as a comparison with similar homes in the area
Home Values in the Area
Average Home Value in this Area
Purchase History
| Date | Buyer | Sale Price | Title Company |
|---|---|---|---|
| Winston John L | -- | None Available | |
| Winston John | -- | Homestead Title | |
| Chaney David M | -- | Homestead Title |
Source: Public Records
Mortgage History
| Date | Status | Borrower | Loan Amount |
|---|---|---|---|
| Open | Winston John | $82,000 | |
| Closed | Chaney David M | $82,000 |
Source: Public Records
Tax History Compared to Growth
Tax History
| Year | Tax Paid | Tax Assessment Tax Assessment Total Assessment is a certain percentage of the fair market value that is determined by local assessors to be the total taxable value of land and additions on the property. | Land | Improvement |
|---|---|---|---|---|
| 2024 | $1,494 | $15,766 | $4,961 | $10,805 |
| 2023 | $1,793 | $17,756 | $3,819 | $13,937 |
| 2022 | $1,943 | $18,687 | $3,819 | $14,868 |
| 2021 | $1,943 | $17,514 | $3,819 | $13,695 |
| 2020 | $1,265 | $11,224 | $3,473 | $7,751 |
| 2019 | $1,188 | $10,281 | $3,473 | $6,808 |
| 2018 | $1,264 | $12,512 | $3,164 | $9,348 |
| 2017 | $1,428 | $11,845 | $3,164 | $8,681 |
| 2016 | $1,121 | $9,338 | $3,164 | $6,174 |
| 2015 | $1,324 | $10,822 | $3,164 | $7,658 |
| 2013 | -- | $9,269 | $3,164 | $6,105 |
Source: Public Records
Map
Nearby Homes
- 19910 Lamar Ave
- 3980 W 201st Terrace
- 4070 W 201st Terrace
- 4160 W 201st Terrace
- 4250 W 201st Terrace
- 4410 W 201st Terrace
- 4515 W 201st Terrace
- 4245 W 201st Terrace
- 4155 W 201st Terrace
- 4065 W 201st Terrace
- 3975 W 201st Terrace
- 20100 Metcalf Ave
- 7540 W 197th St
- 19508 Conser St
- 20106 Delmar St
- Opus II Plan at Southern Meadows
- Sonoma Plan at Southern Meadows
- Inglenook Plan at Southern Meadows
- Delano Plan at Southern Meadows
- Monterey Plan at Southern Meadows