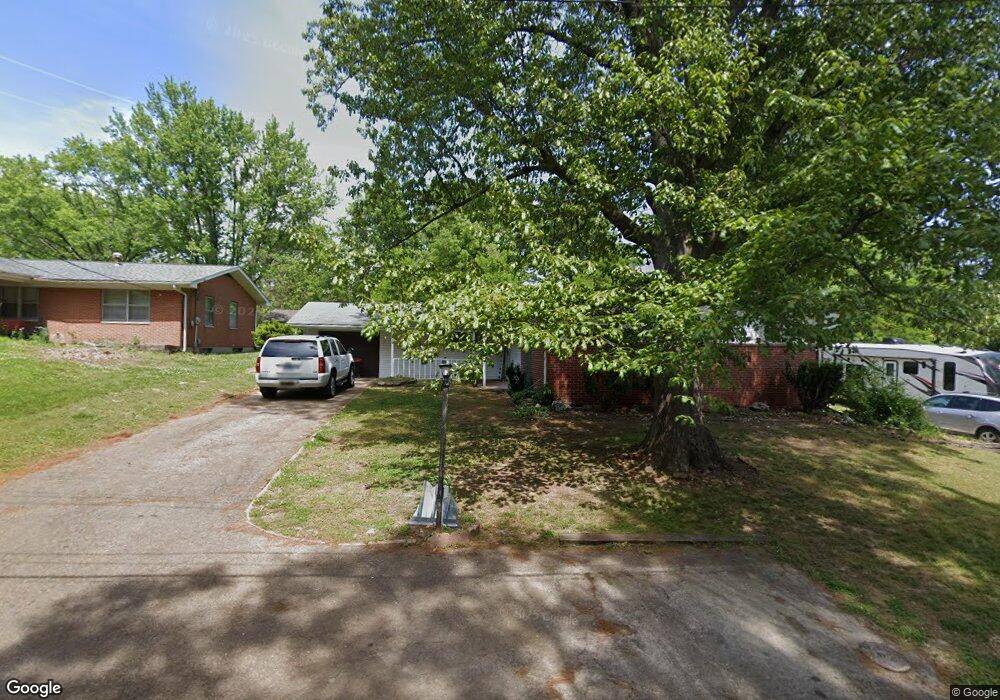
402 Marcinah Ln Fairview Heights, IL 62208
Estimated Value: $171,000 - $216,000
2
Beds
2
Baths
2,288
Sq Ft
$83/Sq Ft
Est. Value
About This Home
This home is located at 402 Marcinah Ln, Fairview Heights, IL 62208 and is currently estimated at $190,168, approximately $83 per square foot. 402 Marcinah Ln is a home located in St. Clair County with nearby schools including Illini Elementary School, Grant Middle School, and Blessed Sacrament Catholic School.
Ownership History
Date
Name
Owned For
Owner Type
Purchase Details
Closed on
Apr 13, 2012
Sold by
Deutsche Bank National Trust Company
Bought by
Gildehaus Ronald and Gildehaus Debra
Current Estimated Value
Home Financials for this Owner
Home Financials are based on the most recent Mortgage that was taken out on this home.
Original Mortgage
$62,000
Interest Rate
3.91%
Mortgage Type
New Conventional
Purchase Details
Closed on
Aug 25, 2011
Sold by
Saunders Steven
Bought by
Deutsche Bank National Trust Company
Purchase Details
Closed on
Dec 14, 2001
Sold by
Wiedower Johna F and Redden Johna F
Bought by
Saunders Steven and Saunders Geneva
Home Financials for this Owner
Home Financials are based on the most recent Mortgage that was taken out on this home.
Original Mortgage
$96,300
Interest Rate
9.74%
Mortgage Type
Purchase Money Mortgage
Create a Home Valuation Report for This Property
The Home Valuation Report is an in-depth analysis detailing your home's value as well as a comparison with similar homes in the area
Home Values in the Area
Average Home Value in this Area
Purchase History
| Date | Buyer | Sale Price | Title Company |
|---|---|---|---|
| Gildehaus Ronald | $50,000 | None Available | |
| Deutsche Bank National Trust Company | -- | None Available | |
| Saunders Steven | $107,000 | Town & Country Title |
Source: Public Records
Mortgage History
| Date | Status | Borrower | Loan Amount |
|---|---|---|---|
| Closed | Gildehaus Ronald | $62,000 | |
| Previous Owner | Saunders Steven | $96,300 | |
| Closed | Saunders Steven | $5,350 |
Source: Public Records
Tax History Compared to Growth
Tax History
| Year | Tax Paid | Tax Assessment Tax Assessment Total Assessment is a certain percentage of the fair market value that is determined by local assessors to be the total taxable value of land and additions on the property. | Land | Improvement |
|---|---|---|---|---|
| 2024 | $4,380 | $55,500 | $4,773 | $50,727 |
| 2023 | $4,164 | $49,106 | $4,223 | $44,883 |
| 2022 | $3,874 | $44,733 | $4,140 | $40,593 |
| 2021 | $3,699 | $42,457 | $3,929 | $38,528 |
| 2020 | $3,639 | $40,218 | $3,722 | $36,496 |
| 2019 | $3,516 | $40,218 | $3,722 | $36,496 |
| 2018 | $3,545 | $40,558 | $3,979 | $36,579 |
| 2017 | $3,469 | $38,913 | $3,818 | $35,095 |
| 2016 | $3,492 | $38,035 | $3,732 | $34,303 |
| 2014 | $1,930 | $47,668 | $3,646 | $44,022 |
| 2013 | $3,600 | $48,546 | $3,713 | $44,833 |
Source: Public Records
Map
Nearby Homes
- 10 Hill Dr Unit . A, B, C
- 10 Hill Dr Unit D, E, F
- 9629 Holdener Place
- 9723 Greenridge Heights Rd
- 1 AC Highridge Dr
- 0 Holdener Dr
- 9915 North Rd
- 10010 S Road Ln
- 504 Saint Clair Rd
- 1314 Dutch Hollow Rd
- 11 Greenwood Ct
- 212 Woodcrest Dr
- 20 Hilldale Dr
- 225 Merriweather Ln
- 25 Clark Dr
- 4 Primrose Ln
- 216 Laurel Dr
- 104 Pyramid Dr
- 9515 Holy Cross Rd
- 9700 Mark Trail
- 9718 Lincoln Trail
- 9722 Old Lincoln Trail
- 405 Marcinah Ln
- 9716 Old Lincoln Trail
- 406 Marcinah Ln
- 9717 Old Lincoln Trail
- 9724 Old Lincoln Trail
- 9721 Old Lincoln Trail
- 409 Marcinah Ln
- 408 Marcinah Ln
- 9713 Old Lincoln Trail
- 9726 Old Lincoln Trail
- 411 Marcinah Ln
- 9709 Old Lincoln Trail
- 9708 Old Lincoln Trail
- 413 Marcinah Ln
- 9729 Lincoln Trail
- 9704 Old Lincoln Trail
- 9732 Old Lincoln Trail
- 9733 Old Lincoln Trail