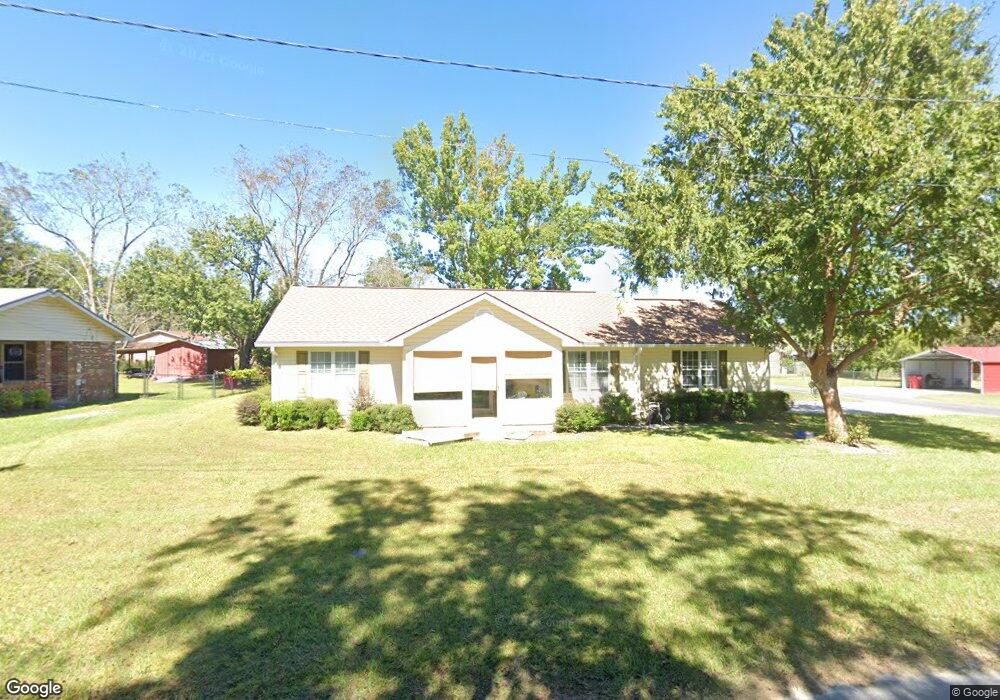
402 Mcgregor St Blackshear, GA 31516
Estimated Value: $172,021 - $200,000
3
Beds
2
Baths
1,176
Sq Ft
$159/Sq Ft
Est. Value
About This Home
This home is located at 402 Mcgregor St, Blackshear, GA 31516 and is currently estimated at $186,505, approximately $158 per square foot. 402 Mcgregor St is a home located in Pierce County with nearby schools including Pierce County High School, Southeast Christian Academy, and Truth Christian Academy.
Ownership History
Date
Name
Owned For
Owner Type
Purchase Details
Closed on
Oct 26, 2021
Sold by
Carter Stephanie L
Bought by
Harder Jacklyn R
Current Estimated Value
Purchase Details
Closed on
Aug 9, 2011
Sold by
Cochran James B
Bought by
Carter Stephanie L and Carter Hughlon Gerald
Home Financials for this Owner
Home Financials are based on the most recent Mortgage that was taken out on this home.
Original Mortgage
$99,481
Interest Rate
4.54%
Mortgage Type
New Conventional
Purchase Details
Closed on
Oct 30, 2007
Sold by
Strickland C Serge
Bought by
Cochran James B and Cochran Bonnie S
Home Financials for this Owner
Home Financials are based on the most recent Mortgage that was taken out on this home.
Original Mortgage
$67,410
Interest Rate
6.26%
Mortgage Type
New Conventional
Purchase Details
Closed on
Jun 4, 2002
Sold by
Thomas Stanley A
Bought by
Strickland C Serge
Purchase Details
Closed on
May 14, 1997
Sold by
Nimmer W T Sr As Executor
Bought by
Thomas Stanley A
Create a Home Valuation Report for This Property
The Home Valuation Report is an in-depth analysis detailing your home's value as well as a comparison with similar homes in the area
Home Values in the Area
Average Home Value in this Area
Purchase History
| Date | Buyer | Sale Price | Title Company |
|---|---|---|---|
| Harder Jacklyn R | $137,000 | -- | |
| Carter Stephanie L | $96,000 | -- | |
| Cochran James B | $74,900 | -- | |
| Strickland C Serge | $65,000 | -- | |
| Thomas Stanley A | $4,700 | -- |
Source: Public Records
Mortgage History
| Date | Status | Borrower | Loan Amount |
|---|---|---|---|
| Previous Owner | Carter Stephanie L | $99,481 | |
| Previous Owner | Cochran James B | $67,410 |
Source: Public Records
Tax History Compared to Growth
Tax History
| Year | Tax Paid | Tax Assessment Tax Assessment Total Assessment is a certain percentage of the fair market value that is determined by local assessors to be the total taxable value of land and additions on the property. | Land | Improvement |
|---|---|---|---|---|
| 2025 | $1,241 | $52,266 | $1,440 | $50,826 |
| 2024 | $1,241 | $50,145 | $1,440 | $48,705 |
| 2023 | $1,240 | $49,994 | $1,440 | $48,554 |
| 2022 | $1,327 | $41,440 | $3,125 | $38,315 |
| 2021 | $1,629 | $39,826 | $3,125 | $36,701 |
| 2020 | $1,583 | $38,213 | $3,125 | $35,088 |
| 2019 | $1,582 | $38,213 | $3,125 | $35,088 |
| 2018 | $1,520 | $36,599 | $3,125 | $33,474 |
| 2017 | $1,484 | $35,631 | $3,125 | $32,506 |
| 2016 | $1,480 | $35,631 | $3,125 | $32,506 |
| 2015 | $1,132 | $35,630 | $3,125 | $32,506 |
| 2014 | $1,132 | $35,631 | $3,125 | $32,506 |
| 2013 | $1,132 | $35,630 | $3,125 | $32,505 |
Source: Public Records
Map
Nearby Homes
- 322 Mcgregor St
- 515 Grady St
- 3551 Cason Rd
- 420 Jackson St
- 331 Central Ave W
- 810 Jackson St
- 3360 Strickland Avenue Extension
- 3344 Strickland Ave
- 0001 Georgia 121
- ST. ROUTE 121 Georgia 121
- 121 Beaver Dr
- 706 Jenkins St
- 862 Watson St
- 622 E Main St
- 131 Fawn Ln
- 101 Fawn Ln
- 2936 Piney Grove Cir
- 830 Jane St
- 1157 Tanner Cir
- 915 Jane St
- 408 Mcgregor St
- 332 Mcgregor St
- 409 Mcgregor St
- 405 Hillcrest Blvd
- 321 Hillcrest Blvd
- 413 Hillcrest Blvd
- 327 Mcgregor St
- 0 Hillcrest Blvd
- 317 Hillcrest Blvd
- 321 Mcgregor St
- 408 Hillcrest Blvd
- 314 Mcgregor St
- 416 Hillcrest Blvd
- 510 Hendry St
- 424 Hillcrest Blvd
- 503 Grady St
- 307 Mcgregor St
- 615 Nimmer St
- 419 Grady St
- 324 Strickland Ave