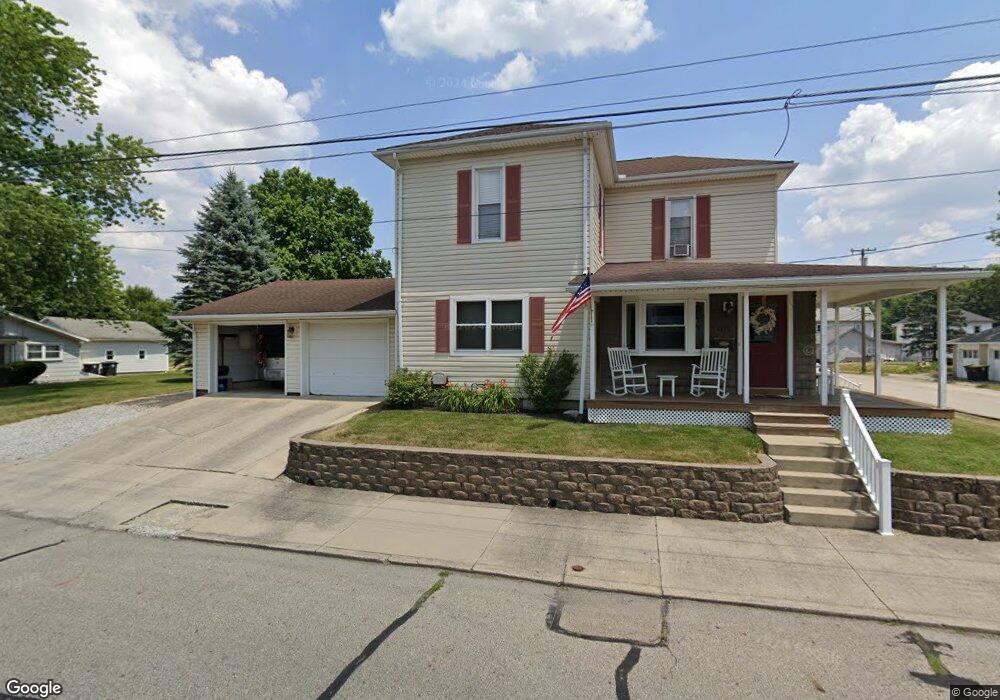
402 N Main St Covington, OH 45318
Estimated Value: $244,000 - $294,842
4
Beds
2
Baths
2,080
Sq Ft
$129/Sq Ft
Est. Value
About This Home
This home is located at 402 N Main St, Covington, OH 45318 and is currently estimated at $268,961, approximately $129 per square foot. 402 N Main St is a home located in Miami County with nearby schools including Covington Elementary/Junior High School, Covington Junior High School, and Covington High School.
Ownership History
Date
Name
Owned For
Owner Type
Purchase Details
Closed on
Nov 10, 2014
Sold by
Lavey Gary B and Lavey Amy S
Bought by
Burelison Jordan T and Burelison Heather L
Current Estimated Value
Home Financials for this Owner
Home Financials are based on the most recent Mortgage that was taken out on this home.
Original Mortgage
$135,000
Outstanding Balance
$104,135
Interest Rate
4.19%
Mortgage Type
Purchase Money Mortgage
Estimated Equity
$164,826
Purchase Details
Closed on
Apr 23, 2003
Sold by
Bundy Anthony C and Bundy Vesta E
Bought by
Lavey Gary B and Lavey Amy S
Home Financials for this Owner
Home Financials are based on the most recent Mortgage that was taken out on this home.
Original Mortgage
$92,000
Interest Rate
5.71%
Mortgage Type
New Conventional
Purchase Details
Closed on
Jan 1, 1990
Bought by
Bundy Anthony C
Create a Home Valuation Report for This Property
The Home Valuation Report is an in-depth analysis detailing your home's value as well as a comparison with similar homes in the area
Home Values in the Area
Average Home Value in this Area
Purchase History
| Date | Buyer | Sale Price | Title Company |
|---|---|---|---|
| Burelison Jordan T | $150,000 | Title Masters | |
| Lavey Gary B | $115,000 | -- | |
| Bundy Anthony C | -- | -- |
Source: Public Records
Mortgage History
| Date | Status | Borrower | Loan Amount |
|---|---|---|---|
| Open | Burelison Jordan T | $135,000 | |
| Previous Owner | Lavey Gary B | $92,000 |
Source: Public Records
Tax History Compared to Growth
Tax History
| Year | Tax Paid | Tax Assessment Tax Assessment Total Assessment is a certain percentage of the fair market value that is determined by local assessors to be the total taxable value of land and additions on the property. | Land | Improvement |
|---|---|---|---|---|
| 2024 | $2,610 | $69,650 | $13,650 | $56,000 |
| 2023 | $2,610 | $69,650 | $13,650 | $56,000 |
| 2022 | $2,603 | $69,650 | $13,650 | $56,000 |
| 2021 | $2,162 | $53,590 | $10,500 | $43,090 |
| 2020 | $2,167 | $53,590 | $10,500 | $43,090 |
| 2019 | $2,177 | $53,590 | $10,500 | $43,090 |
| 2018 | $1,755 | $43,120 | $8,190 | $34,930 |
| 2017 | $1,786 | $43,120 | $8,190 | $34,930 |
| 2016 | $1,763 | $43,120 | $8,190 | $34,930 |
| 2015 | $1,626 | $41,480 | $7,880 | $33,600 |
| 2014 | $1,626 | $41,480 | $7,880 | $33,600 |
| 2013 | $1,565 | $41,480 | $7,880 | $33,600 |
Source: Public Records
Map
Nearby Homes
- 501 N Main St Unit C1
- 133 W Broadway St
- 520 N Pearl St
- 124 N Main St
- 731 N Pearl St
- 00 W Piqua Clay Rd
- 223 Henry Ct
- 271 N Ludlow St
- 698 E Broadway St
- 221 S High St
- 536 S High St
- 5225 N Front St
- 8341 W Covington Gettysburg Rd
- 206 Charles Ct
- 204 Charles Ct
- 210 Charles Ct
- 208 Charles Ct
- 202 Charles Ct
- 212 Charles Ct
- 203 Charles Ct